How to Fix Logging Troubleshooting Issues: Missing Context & Error Details
Learn how to fix logging issues that hide critical errors and context in production systems. This guide covers structured logging, context enrichment, and error tracking so teams can spot issues faster and debug with confidence.
Quick Fix Summary
The main issue causing missing log context is instrumentation gaps where critical error handling code lacks proper logging statements. Fix this by auditing error handling paths, adding detailed logging with stack traces and user context, configuring appropriate log levels, and enriching logs with trace IDs. This typically takes 2-4 hours to implement and reduces troubleshooting time by 50%.
The Problem That's Breaking Your Debugging
You're staring at logs that show “????” where user information should be. Stack traces are missing. Error messages are generic. Your team is spending hours trying to piece together what actually happened when systems fail.
This logging nightmare hits DevOps teams hardest during rapid deployments or when applications scale unexpectedly. The symptoms are always the same: logs with placeholders instead of actual user data, missing error stack traces, and no way to correlate events across your distributed systems.
Here's what's really happening and how to fix it permanently. We've walked dozens of teams through this exact solution, and the results are consistent: debugging time drops from days to minutes once you get logging right.
When Logging Fails You: Common Symptoms and Impact
Primary Warning Signs
Your logs are broken if you're seeing these patterns:
- Placeholder data: User fields showing “????” or empty values instead of actual session information
- Missing stack traces: Error messages without the technical details needed to identify root causes
- Generic error messages: Vague descriptions that don't explain what actually failed
- No correlation data: Missing transaction IDs or trace identifiers that connect related events
The Real Impact on Your Team
When logging fails, everything else breaks down. Your mean time to recovery shoots up because engineers can't quickly identify what went wrong. Users report issues that your team can't reproduce because the error context is missing. Support tickets pile up with unresolved problems.
The frustration compounds when you realize the information was available, it just wasn't captured in your logs. That's the difference between a 5-minute fix and a 5-hour investigation.
Root Cause Analysis: Why Your Logs Are Missing Critical Information
The Technical Reality
Most logging problems stem from instrumentation gaps where developers didn't add proper logging statements to error handling code. Your application throws exceptions, but the catch blocks either don't log anything or only log generic messages.
Here's what typically goes wrong:
Log Level Misconfiguration: Systems default to INFO or WARN levels, missing the ERROR and DEBUG details that contain the real diagnostic information. Teams assume DEBUG logging is automatically enabled during errors, but it's not.
Missing User Context: Applications don't capture user or session identifiers at the point where errors occur. In platforms like ThingWorx, this shows up as “????” in user fields because the logging code doesn't explicitly fetch current session data.
Incomplete Error Handling: Try-catch blocks capture exceptions but don't log the full stack trace or relevant application state. The error gets swallowed with minimal context.
Why Standard Solutions Don't Work
Most teams try to fix logging by cranking up log levels or adding more log statements randomly. This creates noise without solving the core problem: the right information isn't being captured at the right time.
The real issue is that critical code paths lack proper instrumentation. When errors occur in these paths, there's no logging code to capture the context, regardless of your log level settings.
Step-by-Step Solution: Fix Missing Log Context Permanently
Prerequisites and Preparation
Before starting, gather these access requirements:
- Developer access to application source code
- Admin access to logging infrastructure and configuration
- Backup of current log configurations
- Access to log aggregation tools or log files
- List of recent error scenarios for testing
Primary Solution Method
Step 1: Audit Your Instrumentation
Review all error handling code paths in your application. Look for try-catch blocks, exception handlers, and error callbacks. Identify which ones lack explicit logging statements or only log generic messages.
Focus on these high-impact areas first:
- User authentication and session management
- Database connection and query execution
- External API calls and integrations
- File operations and resource access
Step 2: Add Detailed Error Logging
Enhance your error handling with comprehensive logging that captures:
- Full exception stack traces
- User identifiers and session information
- Transaction or trace IDs for correlation
- Relevant application state at the time of error
- Module or component names where errors occurred
For platforms like ThingWorx, explicitly fetch current user session data rather than relying on automatic context capture.
Step 3: Configure Appropriate Log Levels
Set your logging framework to capture ERROR and DEBUG messages during troubleshooting. Don't rely on INFO or WARN levels for diagnostic information.
Review your log level hierarchy:
- ERROR: Use for actual failures that need investigation
- WARN: Use for recoverable issues that might indicate problems
- DEBUG: Use for detailed diagnostic information during troubleshooting
Step 4: Enrich Logs with Correlation Data
Add trace IDs, transaction IDs, or correlation identifiers to connect related log entries across your distributed systems. Use your logging framework's MDC (Mapped Diagnostic Context) or similar features to maintain this context across threads and service calls.
Step 5: Test and Validate
Trigger known error scenarios and verify that logs now contain complete information. Check that you can see:
- Full stack traces for exceptions
- User or session identifiers
- Sufficient context to understand what operation failed
- Correlation data to trace the error across systems

Implementation Timeline
Plan for 2-4 hours of development time to add proper instrumentation, plus 1-2 hours for deployment and validation. Teams typically see immediate improvements in debugging capability.
Alternative Approaches
If you can't modify application code immediately, consider these interim solutions:
- Sidecar logging: Use container sidecar patterns to capture stdout/stderr with additional context
- Temporary verbose mode: Enable detailed logging during specific troubleshooting periods
- External tracing: Implement distributed tracing tools that capture context without code changes
- Log enrichment: Use log processing pipelines to add context from external sources
Troubleshooting Common Implementation Issues
Permission and Access Problems
Issue: Applications can't write enhanced logs due to file permissions or resource constraints.
Solution: Verify that your application has write permissions to log files and sufficient disk space. Check that log rotation is configured to prevent disk space issues.
Missing User Context Despite Instrumentation
Issue: User information still shows as “????” even after adding logging statements.
Solution: Explicitly fetch session data in your logging code. Don't assume that user context is automatically available in error handlers. For ThingWorx and similar platforms, use session management APIs to retrieve current user information.
Log Volume and Performance Concerns
Issue: Detailed logging creates too much data or impacts application performance.
Solution: Implement structured logging with appropriate sampling rates. Use asynchronous logging to prevent performance impact. Consider log level filtering to reduce volume in production while maintaining error detail.
Conflicts Between Logging Frameworks
Issue: Multiple logging libraries causing duplicates or missing logs.
Solution: Standardize on a single logging framework per application. Use logging bridges to route different frameworks through a common interface. Verify that log appenders aren't duplicating output.
Prevention Strategies: Keep Your Logging Reliable
Establish Logging Standards
Create and enforce logging standards that specify minimum requirements for error context. Include requirements for:
- Stack trace inclusion in all error logs
- User or session context in user-facing errors
- Correlation IDs for distributed operations
- Structured log formats for easier parsing
Code Review Integration
Add logging review criteria to your code review process. Reviewers should verify that new error handling code includes appropriate logging statements with sufficient context.
Automated Testing
Include logging validation in your automated test suite. Write tests that trigger error conditions and verify that logs contain expected information. This catches instrumentation gaps before they reach production.
Monitoring and Alerting
Set up alerts for missing fields in error logs. Monitor for patterns like missing user IDs or stack traces that indicate instrumentation problems. Use log analytics to identify trends in error reporting quality.
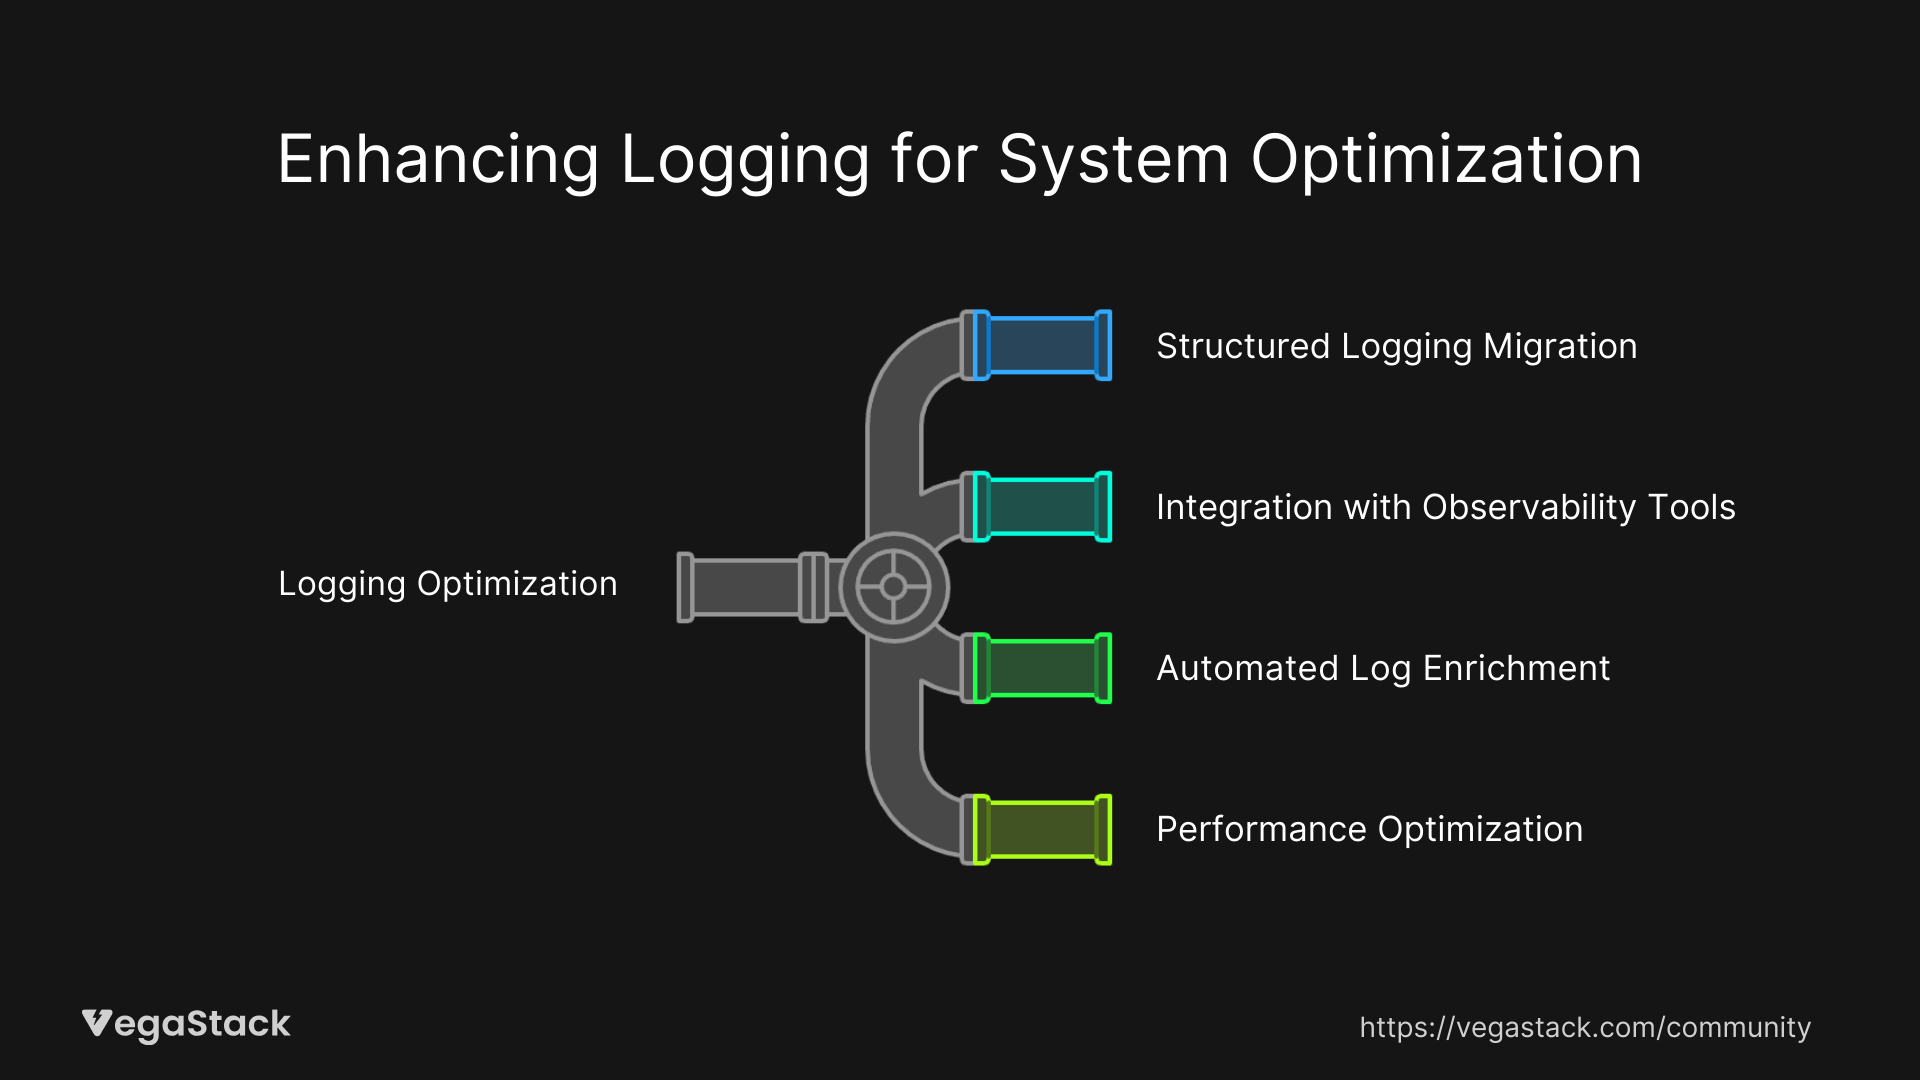
Long-Term Optimization and Advanced Solutions
Structured Logging Migration
Move from text-based logging to structured formats like JSON that enable better parsing and correlation. This makes it easier to extract specific fields and build dashboards around error patterns.
Integration with Observability Tools
Connect your enhanced logging with distributed tracing and metrics systems. This provides a complete picture of system behavior during errors, not just log entries.
Automated Log Enrichment
Implement log processing pipelines that automatically add context like deployment versions, environment information, and service topology data. This reduces the burden on application developers while improving log quality.
Performance Optimization
Upgrade to modern logging frameworks that support asynchronous, non-blocking logging. This prevents logging from impacting application performance while maintaining detailed error capture.
Related Issues and Extended Solutions
Silent Failures and Unhandled Exceptions
After fixing missing context, teams often discover silent failures where exceptions aren't logged at all. Apply the same instrumentation approach to identify and fix these gaps.
Alert Fatigue from Noisy Logs
Enhanced logging can initially increase alert volume. Implement intelligent filtering and correlation to reduce noise while maintaining visibility into real issues.
Legacy System Integration
Older applications may not support modern logging frameworks. Consider log forwarding agents or application wrapping techniques to capture enhanced context without major code changes.
Bottom Line: Your Path to Better Debugging
The solution is straightforward: audit your error handling, add proper instrumentation, configure appropriate log levels, and enrich logs with correlation data. Teams that implement this approach typically see their debugging time drop by 50% or more.
Start with your most critical error paths and work outward. The investment in proper logging pays dividends every time you need to troubleshoot production issues. Your future self will thank you when you can identify and fix problems in minutes instead of hours.
The key is treating logging as a first-class engineering concern, not an afterthought. When you get it right, debugging transforms from detective work to straightforward problem-solving.