Grafana vs. Datadog: Complete Comparison Guide
Make the right monitoring choice with our comprehensive Grafana vs. Datadog comparison. We break down features, pricing, performance, ease of use, and specific use cases to help you choose the perfect monitoring solution for your team's needs and budget. Get the facts you need to decide.
Choosing between Grafana and Datadog can make or break your monitoring strategy. We've spent months testing both platforms across different team sizes and use cases. The reality is that these tools serve different purposes despite both being labeled as "monitoring platforms".
Grafana excels at data visualization and dashboard creation with unmatched flexibility. Datadog provides comprehensive monitoring with built-in analytics and alerting. The choice depends on whether you need a visualization layer for existing data sources or a complete monitoring ecosystem.
This comparison breaks down the key differences between Grafana and Datadog, covering everything from pricing to implementation complexity. We'll help you understand which platform fits your specific monitoring needs and budget constraints.
Quick Comparison Overview
| Feature | Grafana | Datadog |
|---|---|---|
| Primary Focus | Data visualization and dashboarding | Comprehensive monitoring platform |
| Pricing Model | Free open-source, $19/month+usage (Pro), $25,000/year spend commit (Enterprise) | Free open-source, $15/host/month (Pro), $23/host/month (Enterprise) |
| Target Audience | SMEs and enterprises seeking flexibility | Enterprise and large-scale organizations |
| Data Sources | 200+ through plugins | 900+ integrations |
| Best For | Custom visualizations, multi-source dashboards | Unified monitoring, real-time analytics |
| Learning Curve | Steep for beginners | Moderate with pre-built dashboards |
| Deployment | Cloud and on-premise | Primarily cloud-based |
The fundamental difference is approach: Grafana connects to your existing data sources to create visualizations, while Datadog collects, stores, and analyzes data within its platform.
Getting started with Grafana
Overview and Positioning
Grafana Labs built their reputation on solving one problem really well: making data beautiful and accessible. Since 2014, they've maintained their open-source roots while expanding into enterprise services. The platform works as a visualization layer that sits on top of your existing data infrastructure.
What makes Grafana unique is its plugin architecture. You can connect virtually any data source through official or community-built plugins. This flexibility comes at a cost, you need to understand how to configure and maintain these connections.
Key Features and Capabilities
Dashboard Creation: Grafana's dashboard builder is incredibly powerful. You can create custom panels, mix different visualization types, and build interactive dashboards that respond to user input. The templating system lets you create dynamic dashboards that work across multiple environments.
Data Source Flexibility: This is where Grafana shines. Connect to Prometheus, Elasticsearch, MySQL, PostgreSQL, InfluxDB, and hundreds of other data sources. Each connection maintains its native query language, giving you full access to your data's capabilities.
Alerting System: Grafana's alerting has improved significantly. You can set up alerts based on query results, route notifications to different channels, and create alert hierarchies. The system integrates with Slack, PagerDuty, email, and custom webhooks.
User Management: Role-based access control, team management, and dashboard permissions let you control who sees what. The enterprise version adds LDAP integration and advanced security features.
Strengths and Ideal Use Cases
Grafana works best when you already have data infrastructure in place. If you're running Prometheus for metrics, Elasticsearch for logs, and PostgreSQL for business data, Grafana can unify these into cohesive dashboards.
The customization level is unmatched. We've built dashboards that combine infrastructure metrics, application performance data, and business KPIs in ways that wouldn't be possible with other tools. The query editor gives you direct access to your data sources' full capabilities.
Another key benefit is cost savings. The open-source edition covers most needs, and for teams with established monitoring setups, it offers substantial savings over full-scale platforms.
Limitations and Considerations
The learning curve is real. New users often struggle with query languages, especially when working with multiple data sources. Each data source has its own syntax and capabilities, which can be overwhelming.
Grafana doesn't collect or store data by default. You need separate systems for data collection, storage, and processing. This architectural decision provides flexibility but increases complexity for teams starting from scratch.
Security and reliability depend heavily on your setup. You're responsible for securing data sources, managing authentication, and ensuring high availability. The platform is only as reliable as your underlying infrastructure.
Getting started with Datadog
Overview and Positioning
Datadog took a different approach when they launched in 2010. Instead of building a visualization layer, they created a comprehensive monitoring platform that handles everything from data collection to analysis. Their unified approach appeals to organizations that want monitoring without the complexity of managing multiple tools.
The platform's strength lies in correlation. Datadog automatically connects infrastructure metrics with application performance and log data, making it easier to troubleshoot issues across your entire stack.
Key Features and Capabilities
Unified Monitoring: Datadog collects metrics, logs, traces, and security events in one platform. The correlation engine automatically links related data, helping you understand how different system components affect each other.
Real-time Analytics: Built-in analytics capabilities include anomaly detection, forecasting, and trend analysis. The platform processes data in real-time, providing immediate insights into system behavior.
APM and Distributed Tracing: Application performance monitoring tracks requests across services, identifying bottlenecks and performance issues. The distributed tracing feature maps request flows through complex microservice architectures.
Security Monitoring: Datadog Security Monitoring detects threats, monitors compliance, and tracks security events. The platform correlates security data with infrastructure and application metrics for comprehensive visibility.
Extensive Integrations: Over 900 integrations cover cloud platforms, databases, web servers, and third-party services. Most integrations require minimal configuration and provide pre-built dashboards.
Strengths and Ideal Use Cases
Datadog excels in environments where you need comprehensive monitoring without the overhead of managing multiple tools. The platform works particularly well for cloud-native applications and microservice architectures.
The out-of-the-box experience is excellent. Install an agent, enable integrations, and you immediately get useful dashboards and alerts. This reduces time-to-value significantly compared to building monitoring from scratch.
Correlation capabilities set Datadog apart. When an alert fires, you can quickly drill down from infrastructure metrics to application traces to relevant log entries. This integrated approach speeds up troubleshooting and reduces mean time to resolution.
Limitations and Considerations
Cost can escalate quickly. Per-host pricing means expenses grow with your infrastructure. Additional features like APM, log management, and security monitoring add to the monthly bill. Large deployments can easily reach thousands of dollars monthly.
Data retention policies can be limiting. Historical data access depends on your pricing tier, and long-term retention costs extra. This affects capacity planning and trend analysis for growing organizations.
Customization has limits compared to open-source alternatives. While Datadog provides extensive configuration options, you can't modify the core platform or add custom data sources as easily as with Grafana.
Head-to-Head Feature Comparison
| Feature | Grafana | Datadog |
|---|---|---|
| Dashboard Creation | Highly customizable with code-level control | Drag-and-drop builder with templates |
| Data Source Support | 200+ plugins, native query languages | 900+ integrations, standardized interface |
| Alerting | Flexible rules based on queries | AI-powered anomaly detection |
| User Interface | Steeper learning curve, more control | Intuitive interface, faster onboarding |
| Real-time Processing | Depends on data source capabilities | Built-in real-time analytics |
| Mobile Access | Limited mobile optimization | Full-featured mobile apps |
| API Access | Comprehensive REST API | Extensive API with SDKs |
| Performance | Depends on infrastructure setup | Optimized cloud infrastructure |
Ease of Use: Datadog wins for teams that want to start monitoring quickly. Grafana requires more initial setup but provides greater long-term flexibility.
Scalability: Both platforms scale well but through different approaches. Grafana scales through distributed architectures, while Datadog handles scaling automatically in their cloud infrastructure.
Integration Ecosystem: Datadog has more pre-built integrations, but Grafana's plugin system provides deeper customization options.
Use Case Scenarios
When to Choose Grafana
Existing Infrastructure: If you already have Prometheus, Elasticsearch, or other monitoring tools, Grafana provides excellent visualization without replacing your current setup.
Custom Requirements: Teams needing specific visualizations or unique data correlations benefit from Grafana's flexibility. The platform doesn't impose limitations on how you present data.
Budget Constraints: Organizations with limited budgets can use open-source Grafana with existing data sources. This approach minimizes licensing costs while providing professional-grade dashboards.
Multi-Cloud Environments: Grafana works well when you need to visualize data from multiple cloud providers, on-premise systems, and third-party services in unified dashboards.
When to Choose Datadog
Comprehensive Monitoring: Teams starting from scratch or replacing multiple monitoring tools benefit from Datadog's unified approach. One platform handles metrics, logs, traces, and security events.
Fast Implementation: Organizations that need monitoring quickly appreciate Datadog's out-of-the-box capabilities. Pre-built dashboards and automatic correlation reduce setup time.
Enterprise Requirements: Large organizations benefit from Datadog's enterprise features, including advanced security, compliance reporting, and dedicated support.
Cloud-Native Applications: Datadog's APM and distributed tracing excel in containerized and microservice environments.
Migration and Implementation
Grafana Implementation
Setting up Grafana requires planning your data architecture first. Identify your data sources, ensure they're accessible, and plan your dashboard hierarchy. The initial setup takes 1-2 weeks for basic implementations.
Technical Requirements: Docker or Kubernetes for hosting, database for configuration storage, and network access to data sources. Security setup includes SSL certificates and authentication configuration.
Team Preparation: Train team members on query languages for your data sources. Grafana's interface is intuitive, but effective use requires understanding your underlying data systems.
Datadog Implementation
Datadog implementation focuses on agent deployment and integration configuration. Most teams can get basic monitoring running within days.
Agent Deployment: Install Datadog agents on hosts using package managers, containers, or infrastructure-as-code tools. The agent handles data collection automatically.
Integration Setup: Enable relevant integrations through the web interface. Most integrations require minimal configuration and provide immediate value.
Migration Considerations
Grafana to Datadog: Export dashboard configurations and recreate them in Datadog. The process involves mapping data sources to Datadog's metrics and adjusting visualizations to match Datadog's capabilities.
Datadog to Grafana: Set up data collection infrastructure first, then recreate dashboards. This migration is more complex because you need to replace Datadog's data collection and storage capabilities.
Decision Framework
Key Questions to Consider
What's your current monitoring setup? Teams with existing infrastructure should evaluate Grafana's integration capabilities. Organizations starting fresh might prefer Datadog's comprehensive approach.
How important is customization? If you need specific visualizations or unique data correlations, Grafana provides more flexibility. For standard monitoring use cases, Datadog's templates work well.
What's your budget? Calculate total cost of ownership including infrastructure, licensing, and maintenance. Grafana's open-source option reduces licensing costs but increases operational overhead.
How quickly do you need results? Datadog delivers value faster with pre-built dashboards and automatic correlation. Grafana requires more setup time but provides greater long-term flexibility.
Evaluation Approach
Start with a pilot project using both platforms. Set up basic monitoring for a non-critical application and compare the implementation experience, ongoing maintenance requirements, and team adoption.
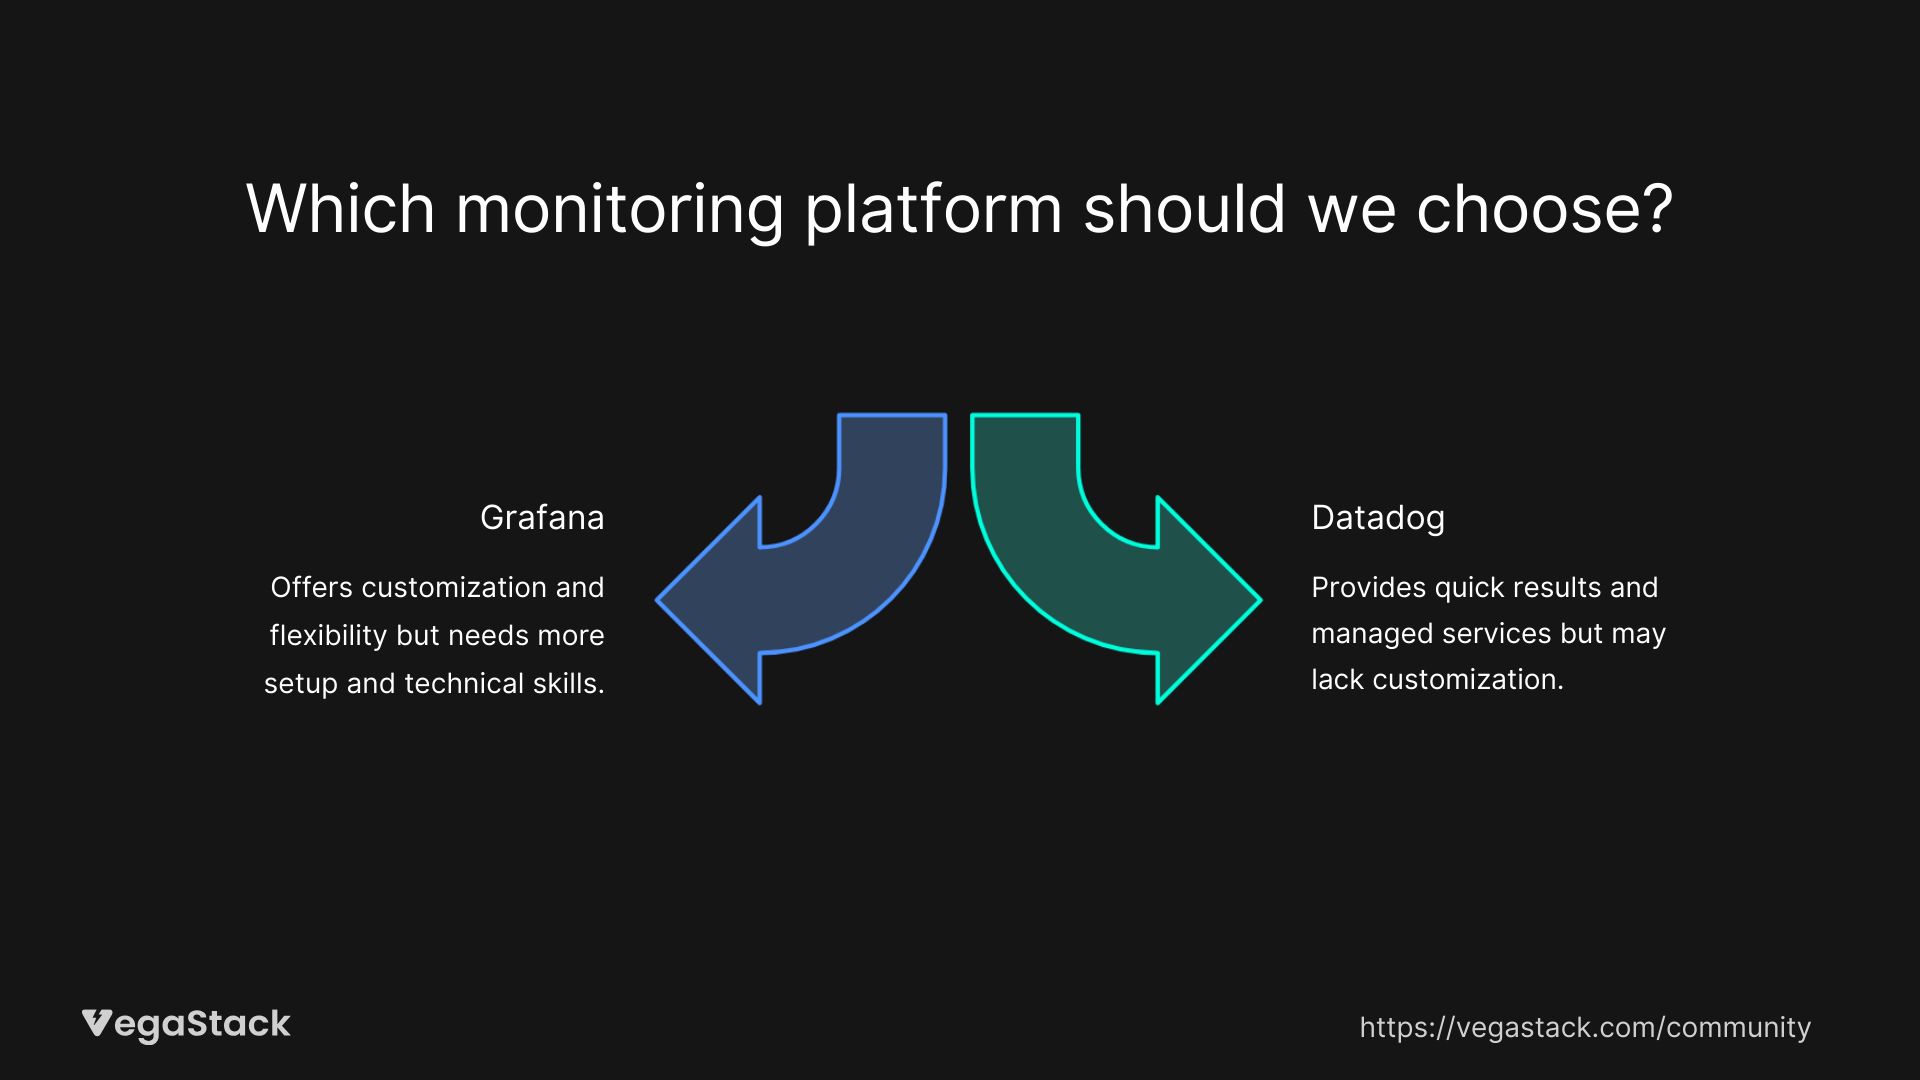
Consider your team's technical skills. Grafana rewards teams with strong technical backgrounds, while Datadog works better for teams that prefer managed services.
Conclusion and Recommendations
The choice between Grafana and Datadog depends on your specific needs and constraints. Grafana excels when you need flexible visualization for existing data sources and have the technical expertise to manage the setup. Datadog works better when you want comprehensive monitoring with minimal operational overhead.
For teams with existing monitoring infrastructure, Grafana provides excellent value and flexibility. The open-source model keeps costs low while providing enterprise-grade visualization capabilities.
Organizations needing comprehensive monitoring should consider Datadog's unified approach. The higher cost is often justified by reduced complexity and faster implementation.
Both platforms continue evolving rapidly. Grafana is adding more enterprise features and improving ease of use, while Datadog expands its analytics capabilities and integration ecosystem. Either choice will serve you well if it aligns with your team's needs and technical capabilities.