Jaeger vs. Zipkin: Distributed Tracing Comparison Guide
Compare Jaeger and Zipkin to choose the right distributed tracing tool for your microservices. This complete guide covers features, performance, ease of deployment, and real use cases. Learn which tool fits your architecture and get practical insights for implementing distributed tracing.
Choosing between Jaeger and Zipkin for distributed tracing can make or break your microservices observability strategy. We've spent months testing both platforms across different environments, and the differences run deeper than most teams realize.
Both tools excel at tracking requests across distributed systems, but they take fundamentally different approaches to sampling, storage, and operational complexity. Jaeger brings enterprise-grade modularity and advanced analytics capabilities, while Zipkin offers simplicity and lightning-fast deployment for smaller teams.
Here's what we'll cover: core architecture differences, sampling strategy implementations, storage backend flexibility, operational overhead comparisons, and real-world performance scenarios. We'll also break down when each tool makes sense for your specific environment and team size.
The choice between these platforms affects everything from your deployment timeline to your long-term operational costs. Let's dig into the details that matter for your distributed tracing decision.
Quick Comparison Overview
| Aspect | Jaeger | Zipkin |
|---|---|---|
| Architecture | Modular, independently scalable components | Bundled, all-in-one deployment |
| Best For | Large-scale, complex microservices | Small to medium microservices environments |
| Sampling | Advanced configurable strategies | Basic sampling implementations |
| Storage Backends | Elasticsearch, Cassandra, Kafka, BadgerDB | Elasticsearch, Cassandra, Kafka, MySQL |
| Operational Complexity | Higher - requires more configuration | Lower - simple setup and maintenance |
| Kubernetes Integration | Native Kubernetes support with Helm charts | Adaptable but less Kubernetes-specific |
| Community Support | Very active CNCF project | Active but smaller community |
| Setup Time | 2-4 hours for basic deployment | 30-60 minutes for basic deployment |
| Target Audience | Enterprise teams, cloud-native environments | Java/Spring teams, startups, SMBs |
Jaeger: Enterprise-Grade Distributed Tracing
Jaeger emerged from Uber's need to monitor massive microservices architectures, and it shows. The platform was built for scale from day one, with a modular architecture that lets you scale each component independently.
Core Architecture and Capabilities
Jaeger's modular design separates the collector, query service, agent, and UI into distinct components. This means you can scale your data ingestion independently from your query performance, which becomes crucial when you're processing millions of traces daily.
The platform excels at distributed context propagation, it tracks requests as they hop between services with remarkable precision. We've seen it handle complex service meshes with 50+ microservices without missing critical trace data.
What sets Jaeger apart is its advanced analytics capabilities. The built-in anomaly detection can spot performance degradations before they impact users. Integration with Prometheus and Elasticsearch enables sophisticated alerting workflows that go beyond basic trace visualization.
Sampling Strategy Implementation
Jaeger's sampling strategies are where it really shines. The platform supports multiple sampling types simultaneously:
- Probabilistic sampling: Configure different sample rates per service
- Rate limiting sampling: Control maximum traces per second
- Adaptive sampling: Automatically adjust sampling based on service performance
- Remote sampling: Centrally manage sampling configurations across your entire infrastructure
We've used the adaptive sampling feature in production environments where traffic patterns change dramatically throughout the day. The system automatically increases sampling during low-traffic periods and reduces it during peak loads, maintaining consistent trace quality without overwhelming storage.
Storage Backend Flexibility
Jaeger supports multiple storage backends with hot-swappable configurations. Elasticsearch provides the most flexibility for custom queries and dashboards. Cassandra offers better write performance for high-volume environments. Kafka enables real-time streaming architectures, while BadgerDB provides embedded storage for smaller deployments.
The storage abstraction layer means you can start with one backend and migrate to another without changing your application instrumentation. We've seen teams begin with Elasticsearch for development and switch to Cassandra for production workloads exceeding 100,000 traces per minute.
Operational Complexity Considerations
Here's where Jaeger demands more from your operations team. The modular architecture requires careful capacity planning for each component. You'll need to monitor collector performance, query service response times, and storage utilization separately.
The configuration complexity increases with scale. Production deployments typically involve multiple collector instances, load balancers, and storage clusters. We recommend dedicating at least one team member to Jaeger operations in environments processing more than 10,000 traces per hour.
Container orchestration becomes essential. Most teams deploy Jaeger on Kubernetes using the official Helm charts, but you'll need solid DevOps practices to manage upgrades and scaling decisions effectively.
Zipkin: Simplicity-First Distributed Tracing
Zipkin takes the opposite approach from Jaeger, everything bundled into a single, straightforward deployment. X (Twitter) originally created it to solve distributed tracing without operational overhead, and that philosophy remains central to the platform.
Streamlined Architecture
Zipkin's all-in-one architecture combines collector, storage, API, and UI into a single process. This dramatically simplifies deployment and reduces the number of moving parts you need to monitor.
The platform excels in Java and Spring Boot environments. Spring Cloud Sleuth provides seamless integration that requires minimal configuration changes. We've seen teams get comprehensive tracing running in production Java applications within hours of initial setup.
Zipkin's visualization capabilities focus on clarity over complexity. The UI presents trace data in intuitive timelines that make root cause analysis straightforward, even for teams new to distributed tracing concepts.
Basic but Effective Sampling
Zipkin's sampling implementation covers essential use cases without advanced complexity. The platform supports:
- Fixed rate sampling: Set consistent sample percentages across services
- Debug sampling: Force sampling for specific trace IDs
- Custom sampling: Implement application-specific sampling logic
The sampling configuration is simpler than Jaeger's but less flexible. Most teams find the basic probabilistic sampling sufficient for typical microservices environments with predictable traffic patterns.
Storage Options and Limitations
Zipkin supports fewer storage backends than Jaeger, but the available options cover most use cases. Elasticsearch provides the best query performance. Cassandra handles high write volumes effectively. MySQL offers familiar relational storage for teams preferring SQL-based backends.
The storage layer is less abstracted than Jaeger's, which means backend selection becomes more permanent. Migration between storage systems typically requires trace data export and import processes.
Operational Simplicity
Zipkin's operational model prioritizes simplicity over flexibility. The single-process architecture means fewer components to monitor and scale. Resource requirements are predictable and well-documented.
Setup complexity is minimal. Most teams can deploy Zipkin in production within an hour using Docker containers or simple JAR deployments. The learning curve is gentler, making it accessible to teams without dedicated observability engineers.
Scaling requires adding more Zipkin instances behind a load balancer. This horizontal scaling approach works well for most environments, though it's less granular than Jaeger's component-level scaling.
Head-to-Head Feature Comparison
| Feature | Jaeger | Zipkin |
|---|---|---|
| Sampling Strategies | Advanced (adaptive, remote, multi-type) | Basic (fixed rate, debug) |
| Storage Backends | 4 options with hot-swapping | 4 options with limited migration |
| Deployment Complexity | High (multiple components) | Low (single component) |
| Scalability Model | Component-level scaling | Instance-level scaling |
| Alerting Integration | Built-in anomaly detection | Third-party tools required |
| Kubernetes Support | Native with Helm charts | Adaptable containers |
| Configuration Management | Complex but flexible | Simple but limited |
| Performance Overhead | Higher initial setup | Lower resource footprint |
| Query Capabilities | Advanced analytics | Basic trace lookup |
| Community Ecosystem | Large CNCF community | Active but smaller |
Use Case Scenarios: When to Choose Each Platform
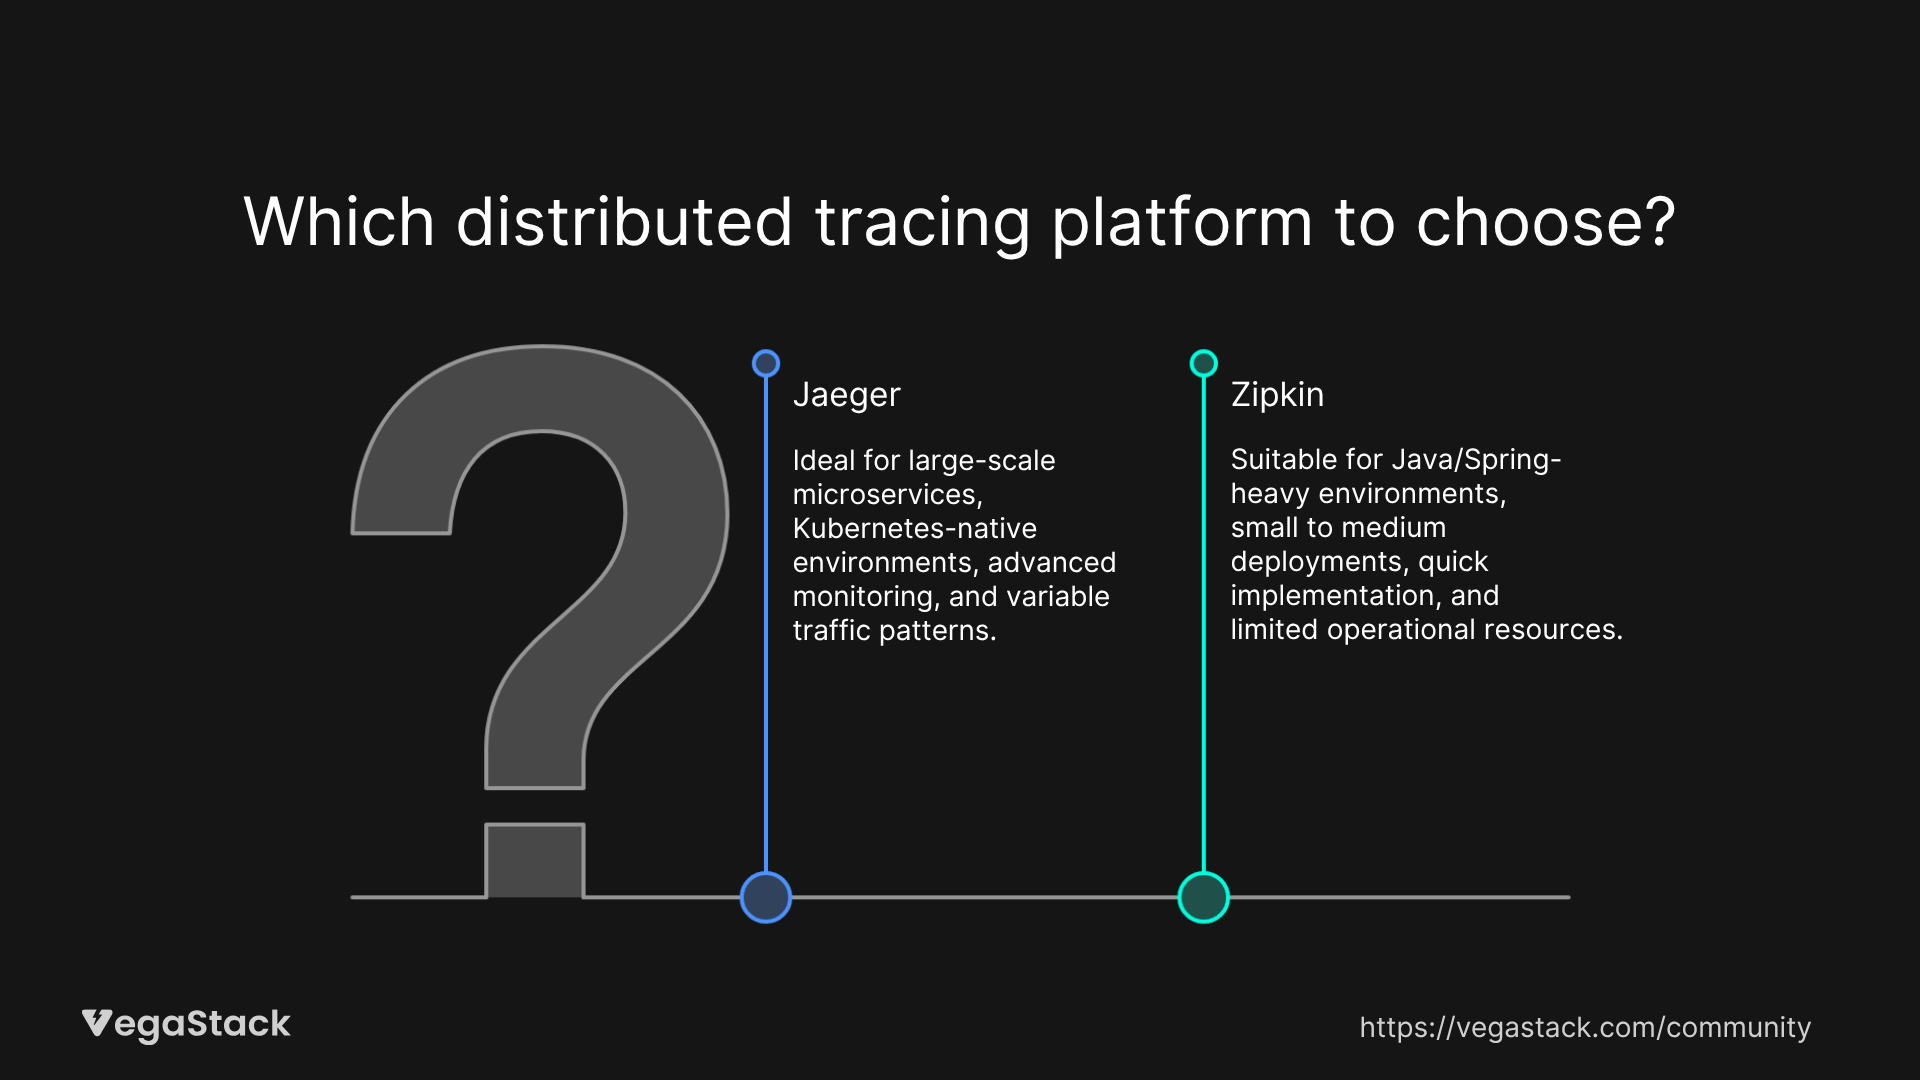
Choose Jaeger When:
Large-scale microservices architectures: If you're running 20+ services with complex interaction patterns, Jaeger's advanced analytics and scalability become essential. We've seen it handle service meshes with hundreds of microservices without performance degradation.
Kubernetes-native environments: Teams already invested in Kubernetes benefit from Jaeger's native integration. The Helm charts and operator support make deployment and management straightforward in container orchestration environments.
Advanced monitoring requirements: When you need anomaly detection, custom alerting, and deep performance analytics, Jaeger's built-in capabilities save months of custom development work.
Variable traffic patterns: Environments with unpredictable load benefit from Jaeger's adaptive sampling. The system automatically adjusts trace collection based on current conditions.
Choose Zipkin When:
Java/Spring-heavy environments: If your microservices are primarily Java-based, Zipkin's Spring Cloud Sleuth integration provides seamless instrumentation with minimal code changes.
Small to medium deployments: Teams with 5-15 microservices often find Zipkin's simplicity perfect. The operational overhead stays manageable while providing comprehensive tracing coverage.
Quick implementation timelines: When you need distributed tracing running in production within days, not weeks, Zipkin's straightforward deployment model accelerates time-to-value.
Limited operational resources: Teams without dedicated DevOps engineers appreciate Zipkin's minimal maintenance requirements. The single-component architecture reduces operational complexity significantly.
Migration and Implementation Considerations
Migrating from Zipkin to Jaeger
The migration path involves architectural changes beyond simple configuration updates. Zipkin's bundled deployment needs restructuring into Jaeger's modular components.
Application instrumentation may require updates to leverage Jaeger's advanced features. The trace data formats are compatible, but sampling configurations need complete reconfiguration.
Plan for 2-4 weeks of migration work in typical environments. The complexity increases with custom integrations and advanced storage configurations.
Migrating from Jaeger to Zipkin
This migration is generally simpler but involves feature loss. Jaeger's advanced analytics and alerting capabilities don't translate to Zipkin's simpler model.
The modular architecture needs consolidation into Zipkin's single-process deployment. Storage backend selection becomes more permanent without Jaeger's hot-swapping capabilities.
Most teams complete this migration in 1-2 weeks, though custom alerting and monitoring integrations require replacement solutions.
Decision Framework: Making the Right Choice
Key Evaluation Questions
What's your microservices scale? More than 20 services typically benefit from Jaeger's advanced capabilities. Fewer than 10 services often work well with Zipkin's simplicity.
How much operational complexity can you handle? Teams with dedicated DevOps resources can leverage Jaeger's flexibility. Smaller teams often prefer Zipkin's straightforward operations.
What's your primary technology stack? Java/Spring environments naturally favor Zipkin. Polyglot or Kubernetes-native architectures often choose Jaeger.
How critical is advanced analytics? Built-in anomaly detection and alerting justify Jaeger's complexity for many teams. Basic trace visualization might be sufficient for others.
Budget and Resource Considerations
Both platforms are open-source, but operational costs differ significantly. Jaeger typically requires more infrastructure resources and dedicated operational expertise. Zipkin's resource requirements are more predictable and manageable.
Consider the total cost of ownership including infrastructure, operational overhead, and team training. Jaeger's advanced capabilities often justify higher operational costs in complex environments.
The Bottom Line: Our Recommendations
Choose Jaeger if you're building large-scale, cloud-native microservices architectures. The advanced sampling strategies, modular scalability, and built-in analytics capabilities are worth the operational complexity. Teams with dedicated DevOps resources and Kubernetes expertise will maximize Jaeger's potential.
Choose Zipkin if you need distributed tracing with minimal operational overhead. The simple deployment model and excellent Java/Spring integration make it perfect for smaller teams or straightforward microservices environments. The quick implementation timeline often outweighs the limited advanced features. We recommend starting with proof-of-concept deployments of both platforms to evaluate which approach fits your operational model better.
The distributed tracing landscape continues evolving, but both Jaeger and Zipkin remain solid choices with active communities and ongoing development. Your decision should align with your team's expertise and architectural complexity rather than following industry trends.