
Introduction
Before we begin talking about how to check memory usage on Linux, let's briefly understand – What is memory usage?
Memory usage on Linux refers to the amount of memory resources utilized by the operating system and running processes. It plays a crucial role in system performance. Linux employs various memory management techniques like virtual memory, caches, and swap space to optimize memory utilization.
In this tutorial, you will check memory usage on Linux. We will also address a few FAQs on how to check memory usage on Linux.
Prerequisites
- User with sudo rights
- Access to a command line/terminal
- The apt package manager
Now that we have all the prerequisites in place, let's dive in!
On Linux, there are several commands that may be used to check memory usage.
cat Command
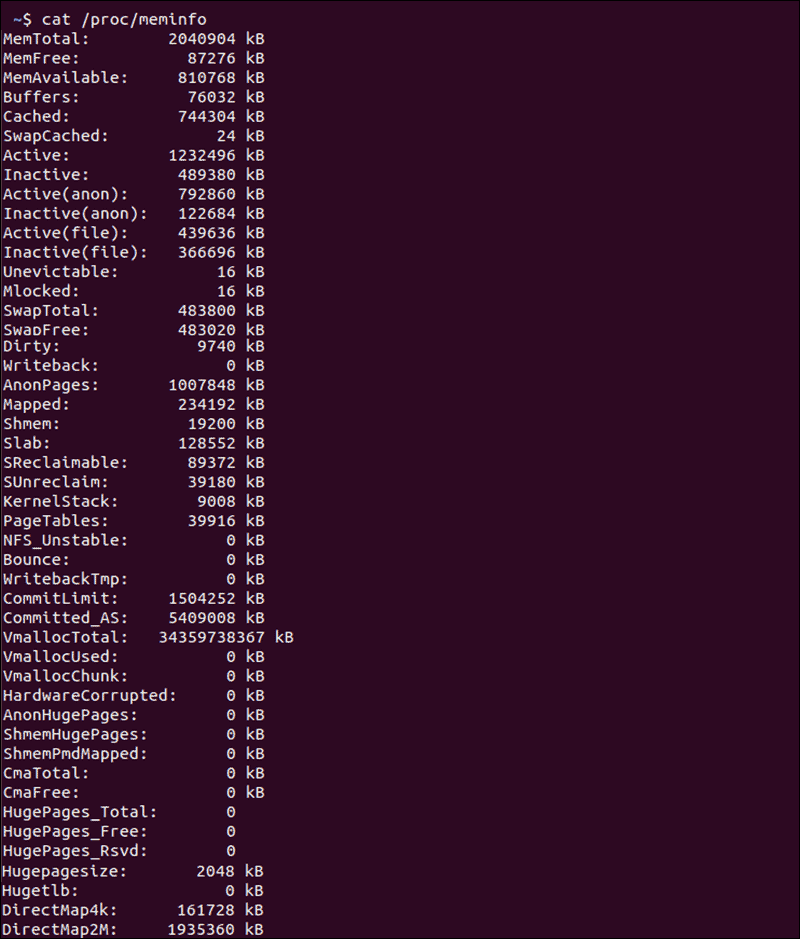
It is used to Show Linux Memory Information.
The /proc/meminfo file is opened by typing cat /proc/meminfo in your terminal.
This is a virtual file that shows how much memory is available and how much is being used. It provides real-time information on the system's memory utilization, as well as the kernel's buffers and shared memory. Depending on the architecture and operating system used, the result may vary slightly.
The information is displayed in kilobytes on the terminal.
free Command
It is used to Display the Amount of Physical and Swap Memory.
In your command prompt, type free to get the following result:
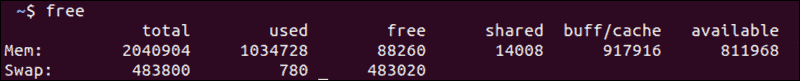
The numbers in kilobytes reflect the used/available memory and swap memory.
| Pattern | Example Matches |
|---|---|
total |
Total installed memory |
used |
Processes that are presently using memory (used= total – free – buff/cache) |
free |
Memory that hasn't been used (free= total – used – buff/cache) |
shared |
Memory shared by multiple processes |
buffers |
Memory set aside by the operating system to be used as buffers when processes require them |
cached |
Recently used files stored in RAM |
buff/cache |
Buffers + Cache |
available |
Without swapping, an estimate of how much memory is available for beginning new applications. |
The free command provides less information than the /proc/meminfo file. It is, nevertheless, simpler to comprehend. The available value is the most important figure since it shows how much RAM is still available for executing new applications.
The free command includes a number of options for formatting the output to better fit your needs. The most useful versions of the free command are listed in the table below.
| Options | Result |
|---|---|
-b |
output in bytes |
-k |
output in kibibytes |
-m |
output in mebibytes |
-g |
output in gibibytes |
-l |
detailed low and high memory statistics |
-o |
old format (no -/+buffers/cache line) |
-t |
total for RAM + swap |
-s |
update every [delay] seconds |
-c |
update [count] times |
man free, like most commands, gives a list of all versions and descriptions of the outcomes.vmstat Command
It is used to Report Virtual Memory Statistics.
Virtual memory statistics are reported by the vmstat command, which is a helpful tool.
Processes, memory, paging, block IO, traps, and CPU activity are all displayed by vmstat.
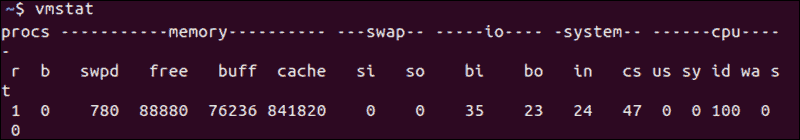
If you need help interpreting the results, the thorough description mentioned below provides an explanation for each value.
Procs
r: The number of processes that are awaiting execution.b: The number of processes that occur during uninterruptible sleep
Memory
swpd: The amount of virtual memory that has been used.free: The amount of memory that is not being used.buffer: How much memory is used as a buffer.cache: The amount of RAM that is used for caching.
Swap
si: Memory swapped in from disk (/s).so: Memory swapped to disk (/s).
IO
bi: Blocks received from a block device.bo: Blocks sent to a block device.
System
in: The total number of interruptions per second (including the clock).cs: It is the number of context switches per second.
CPU - Percentages of total CPU time
us: The amount of time we spend running non-kernel code. (time spent by the user, including pleasant time)sy: Kernel code execution time. (the time on the system)id: The amount of time spent doing nothing. This covers IO-wait time prior to Linux 2.5.41.wa: The amount of time spent waiting for IO. Included in idle prior to Linux 2.5.41.st: Stolen time from a virtual machine. Unknown prior to Linux 2.6.11.
top Command
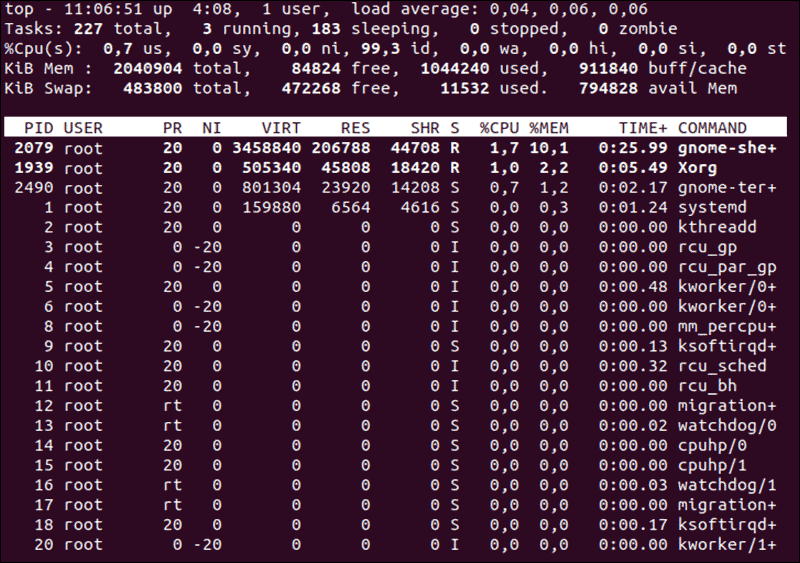
It is used to Check Memory Use.
The top command can be used to see how much memory and CPU each process is using. It provides information on:
- Uptime
- Average load
- Tasks running
- Total number of logged-in users
- Number of CPU/CPUs utilization
- Memory/swap system processes
The data is updated on a regular basis, allowing you to track the processes in real-time.
The top command provides a limited interactive interface in addition to delivering crucial memory information. Command-line options can be used to alter and configure activities.
htop Command
It is used to Find the Memory Load of Each Process.
The information provided by the htop command is comparable to that provided by the top command. The main benefit of the htop command, however, is its user-friendly environment and enhanced features.
The command outputs are in color, have full command lines for processes, and have the ability to scroll both vertically and horizontally.
htop
- The top part features graphic meters and text counters, as well as summary information.
- The detailed data for each step is organized in the lower part. This makes it simple to conduct actions on individual processes.
- You can edit and change the processes fast and without having to input particular commands using the shortcuts listed at the bottom of the screen.
htop command, you must first install the htop function:sudo snap install htopYou can also install using the command below:sudo apt install htopChecking Memory Usage using the GUI
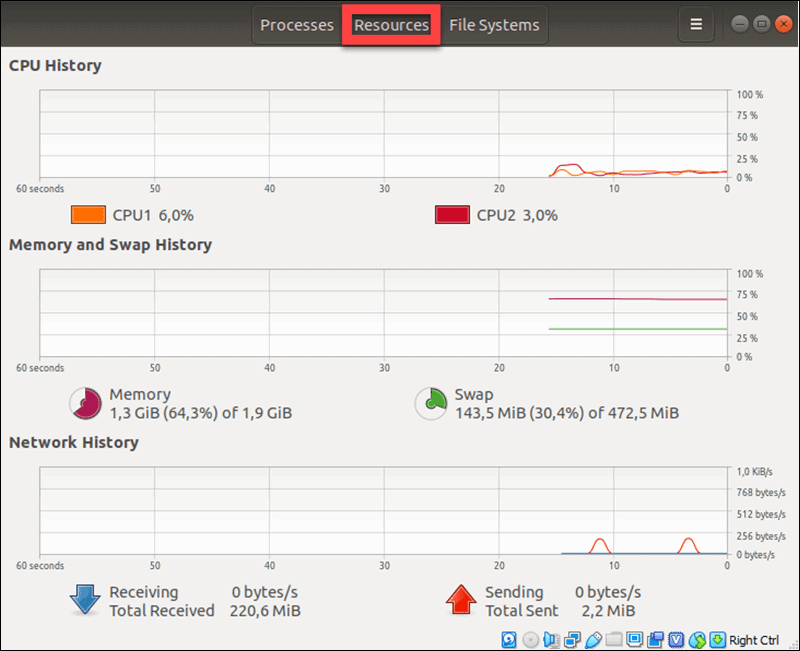
It is uncommon to administer a server using a graphical interface. Certain data sets, on the other hand, are far more obvious, providing a visual representation of memory utilization.
To get to the System Monitor, go to:
- Select Show Applications.
- Access the application by typing System Monitor into the search bar.
- The Resources tab should be selected.
- A graphical representation of your memory consumption in real-time is provided, along with historical data.
FAQs to Check Memory Usage on Linux
How do I interpret the "buffers/cache" value?
The "buffers/cache" value in the free command output represents the memory used for buffers and cache. It includes data cached from disk and memory used for disk I/O buffering. This memory is typically released when needed by applications.
What is the significance of "swap" in memory usage?
Swap is a space on the hard disk used as an extension of physical memory. When the physical memory (RAM) is fully utilized, the Linux kernel moves less actively used data to the swap space. Monitoring swap usage helps identify memory constraints and can indicate inadequate physical memory.
How can I check memory usage by individual processes?
Tools like top, htop, or ps can be used to examine memory usage by individual processes. Sort the output by memory usage (RSS column) to identify the memory-hungry processes.
How can I identify which process is consuming excessive memory?
Checking the RES (resident set size) column using top or htop helps identify the process consuming excessive memory. This column shows the actual physical memory a process uses.
What are the risks of high memory usage?
High memory usage can lead to system slowdowns, unresponsive applications, and crashes. When memory resources are exhausted, the system relies heavily on swap space, which significantly impacts performance.
How can I optimize memory usage on Linux?
To optimize memory usage, start by analyzing memory-hungry processes and consider scaling them appropriately. Additionally, tune system settings, disable unnecessary services, and optimize memory allocation to ensure efficient resource utilization.
What are the common causes of excessive memory usage?
Excessive memory usage is often caused by memory leaks in applications, inefficient memory management by processes, or running resource-intensive applications that require more memory. It can also result from inadequate memory allocation to virtualized environments.
Conclusion
In this tutorial, several options for checking memory utilization on your Linux system were presented.
We discovered that a single command can provide a large amount of useful data for future research. It's crucial to understand how to analyze data appropriately.
If you have any queries, please leave a comment below and we’ll be happy to respond to them.