
Choose a different version or distribution
Introduction
Before we begin talking about how to install Elasticsearch, Logstash, and Kibana (Elastic Stack) on Ubuntu 22.04, let's briefly understand – What is ELK Stack?
Elastic Stack is a powerful suite of open-source software tools designed for data analysis and visualization. It includes Elasticsearch, a search and analytics engine that allows you to store, search, and analyze large volumes of data quickly.
Kibana is another component that helps you visualize and explore data through interactive dashboards and charts. Additionally, Logstash enables you to collect, process, and transform data from various sources before sending it to Elasticsearch. With its flexibility, scalability, and real-time capabilities, Elastic Stack empowers businesses to gain valuable insights from their data efficiently.
You will set up the Elastic Stack on an Ubuntu 22.04 server in this tutorial. You will discover how to set up and configure each element of the Elastic Stack to collect and display system logs, including Filebeat, a Beat used for forwarding and centralizing files and logs.
Furthermore, since Kibana is often only accessible via localhost, we will use Nginx to proxy it so that it can be accessed via a web browser. On a single server, which we will refer to as our Elastic Stack server, we will install each of these parts.
In this tutorial you will install Elasticsearch, Logstash, and Kibana (ELK Stack) on Ubuntu 22.04. We will also address a few FAQs on how to install ELK Stack on Ubuntu 22.04.
Advantages of Elasticsearch, Logstash, and Kibana (Elastic Stack)
- Elasticsearch: Fast and scalable search and analytics engine for real-time data analysis.
- Logstash: Versatile data processing tool for collecting, transforming, and enriching data from multiple sources.
- Kibana: Interactive data visualization and exploration platform with customizable dashboards and charts.
- Centralized Logging: Easily collect, analyze, and monitor logs from various systems and applications in one place.
- Full Stack Integration: Seamless integration of Elasticsearch, Logstash, and Kibana for comprehensive data management and analysis capabilities.
Prerequisites
You'll need the following to finish this tutorial:
A non-root sudo user configured on an Ubuntu 22.04 server with 4GB of RAM and two CPUs. By using Ubuntu 22.04's Initial Server Setup, you can accomplish this. For the purposes of this tutorial, we'll use the bare minimum CPU and RAM needed to operate Elasticsearch. Keep in mind that the CPU, RAM, and storage your Elasticsearch server needs depends on the number of logs you anticipate producing.
Installed is OpenJDK 11. For instructions on how to do this, refer to the section Installing the Default JRE/JDK in our guide How To Install Java with Apt on Ubuntu 22.04.
Step 1 - Installing and Configuring Elasticsearch
The default package repositories for Ubuntu do not contain the Elasticsearch components. But, after adding the package source list for Elastic, they can be installed via APT.
To guard against package spoofing, all the packages are signed with the Elasticsearch signing key. Your package manager will only trust packages that have been authenticated using the key. In order to install Elasticsearch, you must import the Elasticsearch public GPG key and add the Elastic package source list.
To start, import the Elasticsearch public GPG key into APT using cURL, the command-line tool for importing data with URLs. Keep in mind that we are using the -fsSL arguments to silence all progress and potential errors (apart from a server failure) and to permit cURL to submit a request to a different destination if it is redirected. Send the curl command's output to the gpg --dearmor command, which will change the key's format so that apt can use it to verify downloaded packages.
curl -fsSL https://artifacts.elastic.co/GPG-KEY-elasticsearch |sudo gpg --dearmor -o /usr/share/keyrings/elastic.gpg
The Elastic source list should then be added to the sources.list.d directory, where APT will look for new sources:
echo "deb [signed-by=/usr/share/keyrings/elastic.gpg] https://artifacts.elastic.co/packages/7.x/apt stable main" | sudo tee -a /etc/apt/sources.list.d/elastic-7.x.list
The file's [signed-by=/usr/share/keyrings/elastic.gpg] section tells apt to use the downloaded key to verify repository and file information for Elasticsearch packages.
After that, make sure APT can read the new Elastic source by updating your package lists:
sudo apt update
Next, install Elasticsearch by using the following command:
sudo apt install elasticsearch
Elasticsearch has been installed and is ready for configuration. Elasticsearch's main configuration file, elasticsearch.yml, can be edited using your preferred text editor. We will use nano in this case:
sudo nano /etc/elasticsearch/elasticsearch.yml
The elasticsearch.yml file contains configuration options for your cluster, node, paths, memory, network, discovery, and gateway. Although the majority of these options are preconfigured in the file, you can modify them to suit your needs. We will just change the settings for the network host in order to demonstrate a single-server configuration.
On port 9200, Elasticsearch listens for traffic from anywhere. To prevent others from viewing your data or shutting down your Elasticsearch cluster through its [REST API] (https://en.wikipedia.org/wiki/Representational_state_transfer), you should limit external access to your Elasticsearch instance. Find the line that specifies network.host, uncomment it, and change its value to localhost as shown below to limit access and thereby improve security.
. . .
# ---------------------------------- Network -----------------------------------
#
# Set the bind address to a specific IP (IPv4 or IPv6):
#
network.host: localhost
. . .
In order for Elasticsearch to listen on all interfaces and bound IPs, we have specified localhost. You can give an IP address in place of localhost if you just want it to listen on a specific interface. Save and exit elasticsearch.yml. When using nano, you can do this by hitting CTRL+X, then Y, then ENTER.
You can use Elasticsearch with these minimal settings as a starting point. Elasticsearch can now be launched for the first time.
Use systemctl to launch the Elasticsearch service. Give Elasticsearch some time to launch. Otherwise, you risk getting errors stating that you can not connect.
sudo systemctl start elasticsearch
To enable Elasticsearch to start up every time your server boots, execute the following command:
sudo systemctl enable elasticsearch
By making an HTTP request, you can check if your Elasticsearch service is running:
curl -X GET "localhost:9200"
You will receive a response with some basic information about your local node that looks somewhat like this:
Output
{
  "name" : "Elasticsearch",
  "cluster_name" : "elasticsearch",
  "cluster_uuid" : "n8Qu5CjWSmyIXBzRXK-j4A",
  "version" : {
    "number" : "7.17.2",
    "build_flavor" : "default",
    "build_type" : "deb",
    "build_hash" : "de7261de50d90919ae53b0eff9413fd7e5307301",
    "build_date" : "2022-03-28T15:12:21.446567561Z",
    "build_snapshot" : false,
    "lucene_version" : "8.11.1",
    "minimum_wire_compatibility_version" : "6.8.0",
    "minimum_index_compatibility_version" : "6.0.0-beta1"
  },
  "tagline" : "You Know, for Search"
}
The next element of the Elastic Stack, Kibana, should be installed now that Elasticsearch is operational.
Step 2 - Installing and Configuring the Kibana Dashboard
The official documentation advises that Kibana should only be installed after Elasticsearch. This order of installation guarantees that the components on which each product depends are properly positioned.
You can simply use apt to install the other Elastic Stack components, as you have already added the Elastic package source in the previous step:
sudo apt install kibana
After that, enable and launch the Kibana service:
sudo systemctl enable kibana
sudo systemctl start kibana
We need to put up a reverse proxy in order to enable external access to Kibana because it is configured to only listen on localhost. Nginx, which should already be installed on your server, will be used for this.
Create an administrative Kibana user first using the openssl command. This user will be used to access the Kibana web interface. We will use the name kibanaadmin as an example, but you should pick a username that is unusual and challenging to decode in order to increase security.
The administrative Kibana user and password will be created and saved in the htpasswd.users file by the subsequent command. As soon as you read this file, configure Nginx to require this username and password:
echo "kibanaadmin:`openssl passwd -apr1`" | sudo tee -a /etc/nginx/htpasswd.users
When prompted, enter and confirm a password. You will require this login to access the Kibana web interface, so keep it in mind or write it down.
A block file for the Nginx server will then be created. We will call this file your_domain as an example, however, you might find it useful to name yours something more descriptive. For instance, you may name this file after your FQDN if you have configured DNS records and a FQDN for this server.
Create the Nginx server block file using nano or your preferred text editor:
sudo nano /etc/nginx/sites-available/your_domain
Add the following code block to the file, making sure to change your_domain to correspond to the FQDN or public IP address of your server. This code tells Nginx to send HTTP traffic from your server to the Kibana application, which is listening on localhost:5601. It also sets up Nginx so that it can read the htpasswd.users file and require a basic level of authentication.
Please take note that you may have created and filled this file with content if you completed the prerequisite Nginx tutorial. In that instance, remove all existing content from the file before adding the following:
server {
    listen 80;

    server_name your_domain;

    auth_basic "Restricted Access";
    auth_basic_user_file /etc/nginx/htpasswd.users;

    location / {
        proxy_pass http://localhost:5601;
        proxy_http_version 1.1;
        proxy_set_header Upgrade $http_upgrade;
        proxy_set_header Connection 'upgrade';
        proxy_set_header Host $host;
        proxy_cache_bypass $http_upgrade;
    }
}
Save your work and then exit the file.
Next, establish a symbolic link to the sites-enabled directory to activate the new configuration and unlink the default configuration.
sudo ln -s /etc/nginx/sites-available/your_domain /etc/nginx/sites-enabled/your_domain

sudo unlink /etc/nginx/sites-enabled/default
Next, look for syntax errors in the configuration:
sudo nginx -t
Check again to make sure the content you added to your configuration file was added correctly if any errors are reported in your output. Restart the Nginx service once you have confirmed that the output's syntax is ok:
sudo systemctl reload nginx
You should have a UFW firewall enabled if you followed the initial server setup guide. By typing the following, we can modify the rules to allow connections to Nginx:
sudo ufw allow 'Nginx Full'
Note: If you followed the prerequisite Nginx guide, you may have set a UFW rule that allows the Nginx HTTP profile through the firewall. You can safely delete the rule you created in the prerequisite tutorial because the Nginx Full profile permits both HTTP and HTTPS traffic over the firewall. Use the following command to do so:
sudo ufw delete allow 'Nginx HTTP'
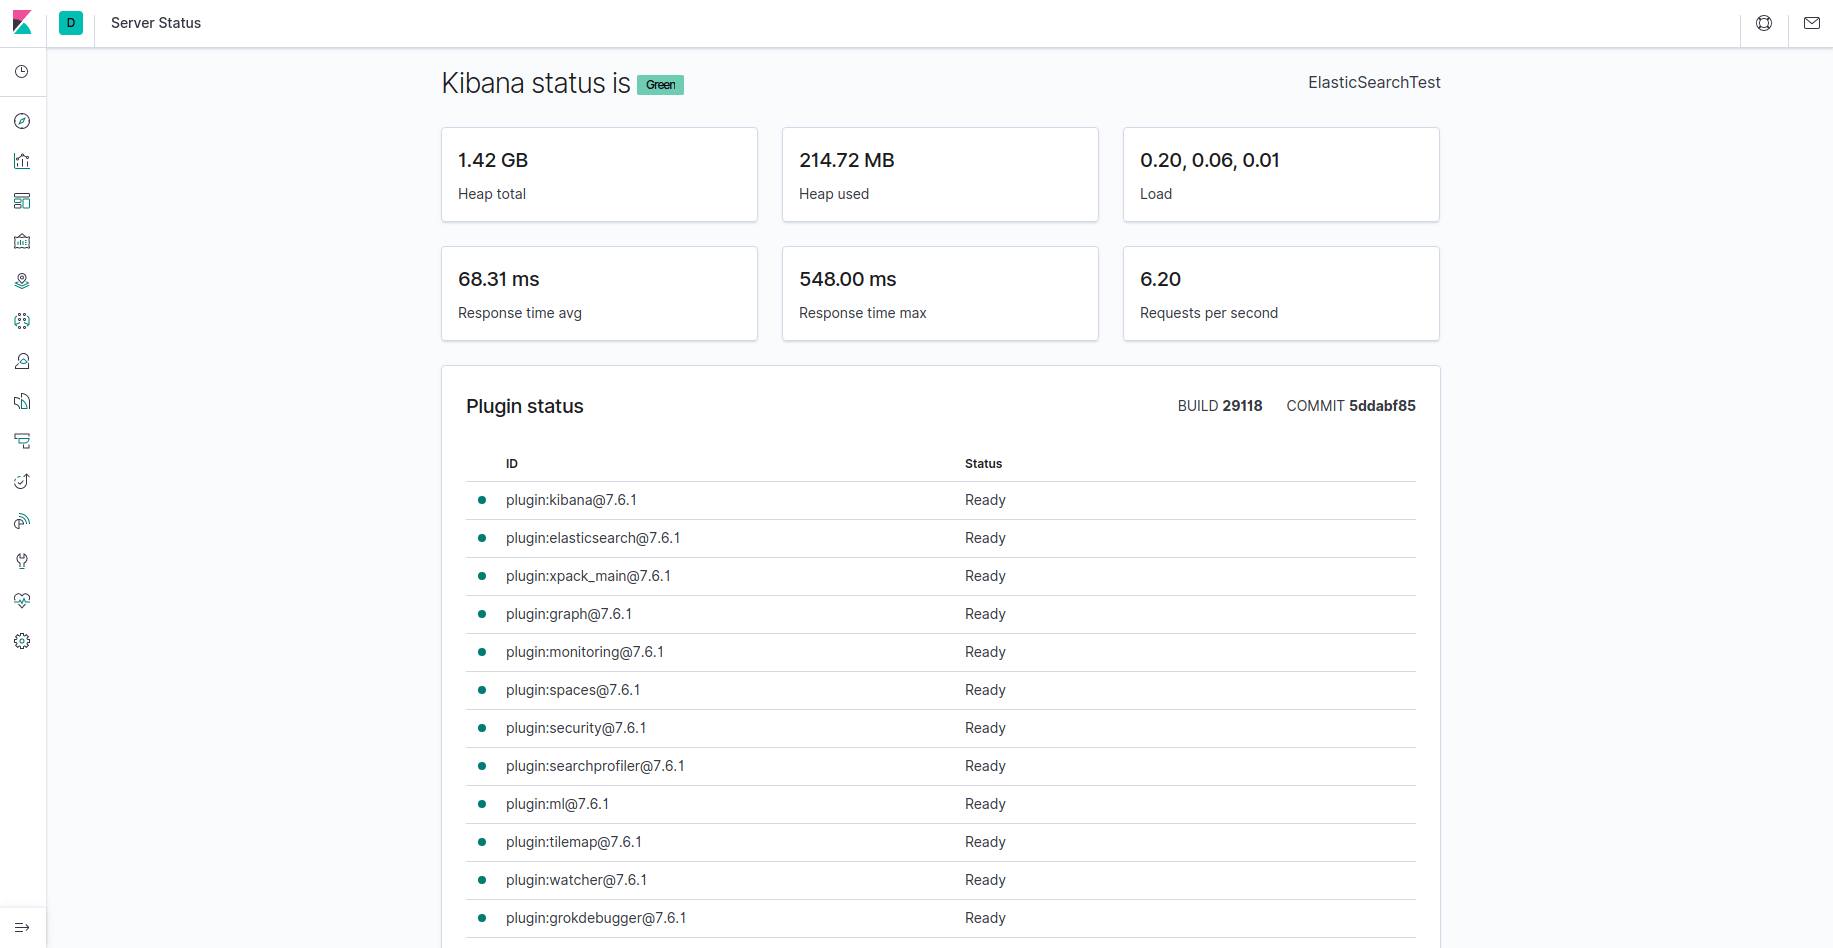
The FQDN or the public IP address of your Elastic Stack server can now be used to access Kibana. When prompted, provide your login information to access the Kibana server's status page by going to the following address:
http://your_domain/status
This status page lists the installed plugins and provides information about the server's resource usage.
Now that the Kibana dashboard has been configured, let us install the next component: Logstash.
Step 3 - Installing and Configuring Logstash
Although Beats can transmit data straight to the Elasticsearch database, it is more common to process the data with Logstash. This gives you more freedom to take data from many sources, turn it into a standard format, and export it to another database.
This command will install Logstash:
sudo apt install logstash
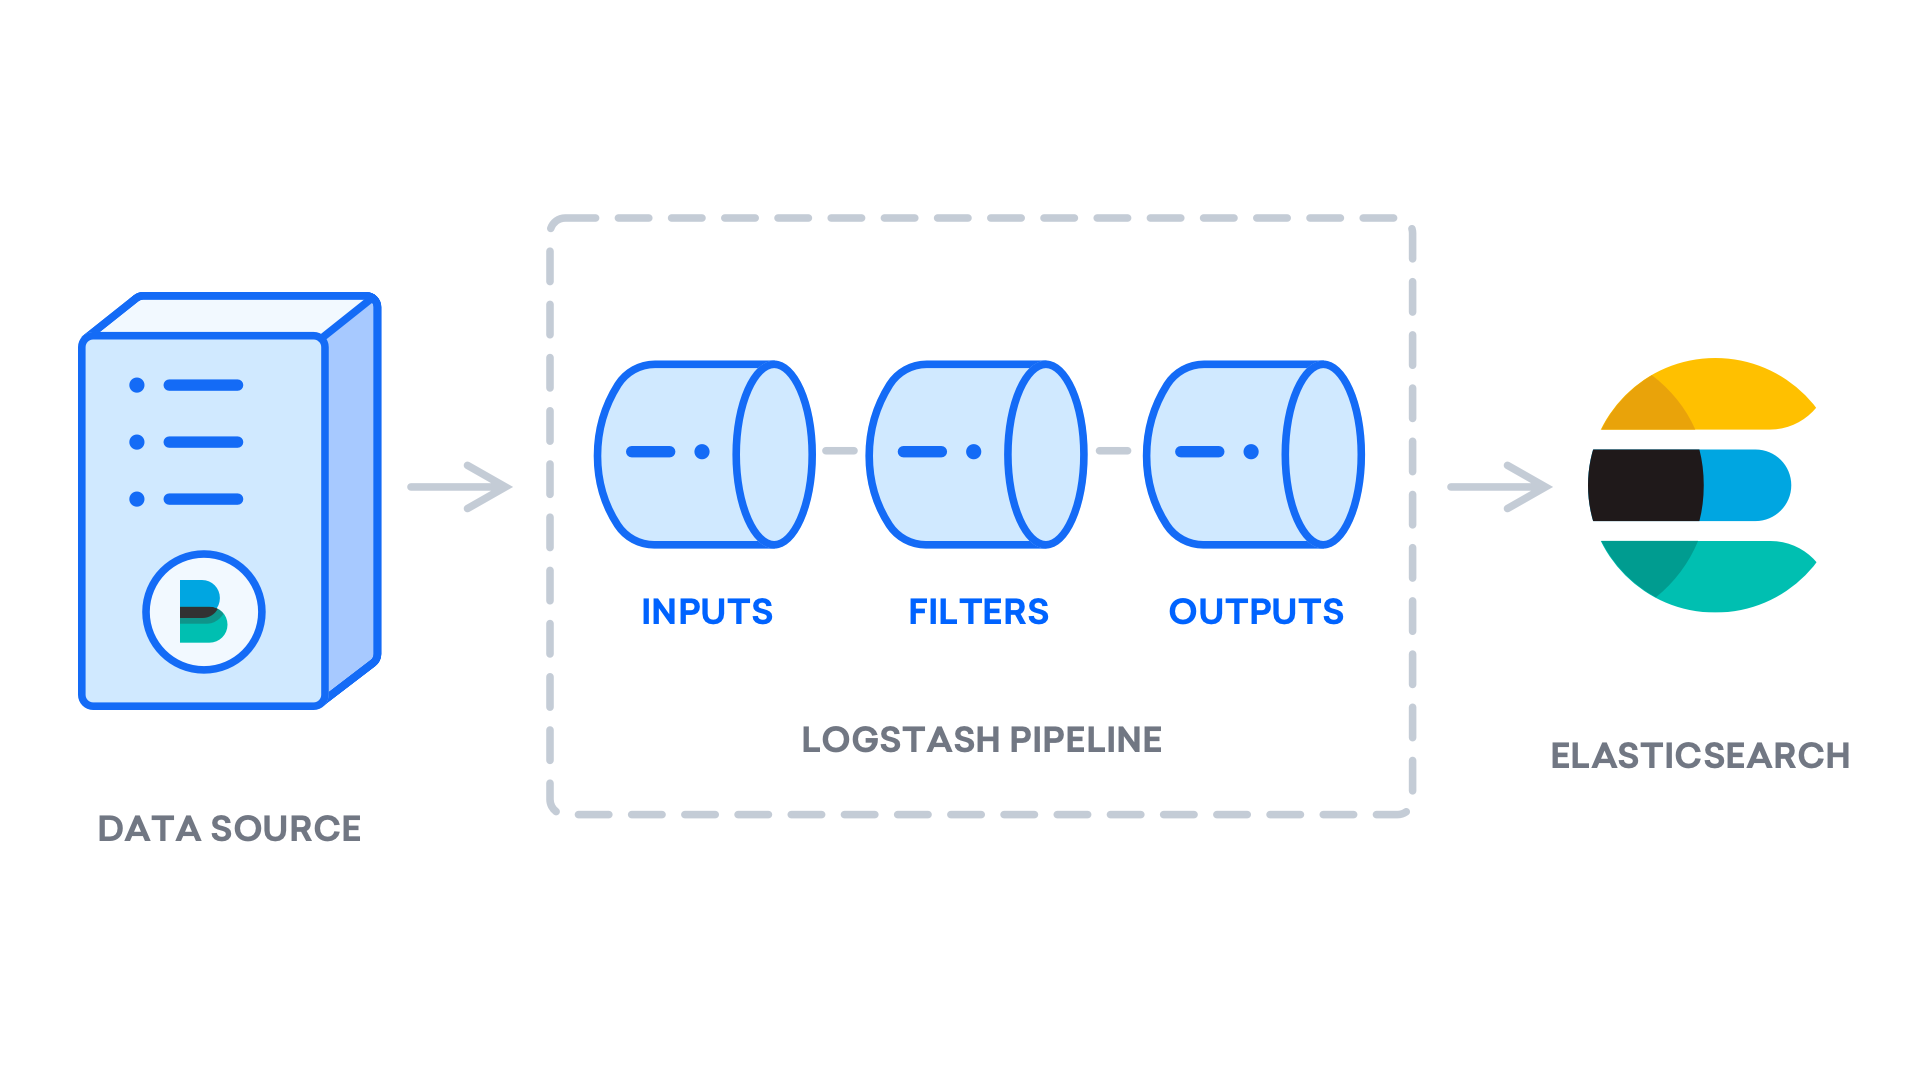
You can start configuring Logstash after installing it. The configuration files for Logstash are located in the /etc/logstash/conf.d directory. Check out the configuration reference that Elastic offers for further details on the configuration syntax. It is helpful to think of Logstash as a pipeline that receives data at one end, processes it in some way, and then transmits it to its destination (in this case, the destination being Elasticsearch). input and output are the two components that must be present in a Logstash pipeline. filter is an optional component. The data is consumed by the input plugins from a source, processed by the filter plugins, and then written to a destination by the output plugins.
Set up your Filebeat input in a configuration file called 02-beats-input.conf:
sudo nano /etc/logstash/conf.d/02-beats-input.conf
Add the following input configuration. This specifies a beats input listening on TCP port 5044.
input {
  beats {
    port => 5044
  }
}
Save the work, then exit.
Create a configuration file with the name 30-elasticsearch-output.conf next:
sudo nano /etc/logstash/conf.d/30-elasticsearch-output.conf
Add the following output configuration. Basically, this output sets up Logstash to store the Beats data in an index called after the Beat used in Elasticsearch, which is running at localhost:9200. This tutorial uses Filebeat as the beat.
output {
  if [@metadata][pipeline] {
	elasticsearch {
  	hosts => ["localhost:9200"]
  	manage_template => false
  	index => "%{[@metadata][beat]}-%{[@metadata][version]}-%{+YYYY.MM.dd}"
  	pipeline => "%{[@metadata][pipeline]}"
	}
  } else {
	elasticsearch {
  	hosts => ["localhost:9200"]
  	manage_template => false
  	index => "%{[@metadata][beat]}-%{[@metadata][version]}-%{+YYYY.MM.dd}"
	}
  }
}
Save the work, then exit.
Use the following command to test your Logstash configuration:
sudo -u logstash /usr/share/logstash/bin/logstash --path.settings /etc/logstash -t
Your output will read Config Validation Result: OK. Exiting Logstash if there are no syntax errors. If you do not see this in your output, look for any errors that might be there and update your configuration to fix them. You should be aware that OpenJDK will issue warnings, but you can disregard them because they should not create any issues.
If your configuration test is successful, start and enable Logstash to apply the configuration changes:
sudo systemctl start logstash
sudo systemctl enable logstash
Let us install Filebeat now that Logstash is up and running and properly configured.
Step 4 - Installing and Configuring Filebeat
To collect data from numerous sources and deliver it to Logstash or Elasticsearch, the Elastic Stack uses several lightweight data shippers known as Beats. Elastic presently has the following Beats available:
- Filebeat: accumulates and sends log files.
- Metricbeat: gathers metrics from your services and systems.
- Packetbeat: gathers and evaluates network data.
- Winlogbeat: gathers the Windows event logs.
- Auditbeat: gathers data from the Linux audit framework and keeps track of file integrity.
- Heartbeat: active probing is used to monitor the availability of services.
In this article, we will use Filebeat to send local logs to our Elastic Stack.
Using apt, install Filebeat:
sudo apt install filebeat
Next, set up a connection between Filebeat and Logstash. In this section, we will change the Filebeat example configuration file.
Go to the Filebeat configuration file:
sudo nano /etc/filebeat/filebeat.yml
Although Filebeat has many outputs, you will normally only send events directly to Elasticsearch or Logstash for further processing. In this tutorial, we will use Logstash to further process the information that Filebeat has gathered.
Since that Filebeat will not need to send any data directly to Elasticsearch, let us disable that output. To achieve this, locate the output.elasticsearch section and add a # before the following lines to mark them as commented out:
...
#output.elasticsearch:
  # Array of hosts to connect to.
  #hosts: ["localhost:9200"]
...
The output.logstash section should then be configured. Remove the # to uncomment the lines output.logstash: and hosts: ["localhost:5044"]. This will set up Filebeat to connect to your Elastic Stack server's Logstash at port 5044, which is the port for which we previously specified a Logstash input:
output.logstash:
  # The Logstash hosts
  hosts: ["localhost:5044"]
Save the work, then exit.
Filebeat modules can be used to extend the functionality of Filebeat. In this tutorial, we will be using the system module, which gathers and analyzes system logging service logs from popular Linux distributions.
Enable it now:
sudo filebeat modules enable system
Use the following command to see a list of enabled and disabled modules:
sudo filebeat modules list
You will see a list that looks somewhat like this:
Output
Enabled:
system

Disabled:
apache2
auditd
elasticsearch
icinga
iis
kafka
kibana
logstash
mongodb
mysql
nginx
osquery
postgresql
redis
traefik
...
Filebeat is set up by default to use the default paths for the syslog and authorization logs. You do not need to alter any configurations for this tutorial. The /etc/filebeat/modules.d/system.yml configuration file can be used to view the module's parameters.
The Filebeat ingest pipelines must then be configured so that the log data may be parsed before being sent to Elasticsearch through logstash. Enter the following commands to load the system module's ingest pipeline:
sudo filebeat setup --pipelines --modules system
The index template should then be loaded into Elasticsearch. An Elasticsearch index is a group of documents with related properties. A name is given to each index, and this name is used to refer to the index when carrying out various operations on it. When a new index is created, the index template will be automatically applied.
Use the following command to load the template:
sudo filebeat setup --index-management -E output.logstash.enabled=false -E 'output.elasticsearch.hosts=["localhost:9200"]'
Output
Index setup finished.
You may display Filebeat data in Kibana by using the sample dashboards that come included with Filebeat. You must make the index pattern and import the dashboards into Kibana before you can use them.
As the dashboards load, Filebeat connects to Elasticsearch to verify version information. While Logstash is enabled, you must disable Logstash output and enable Elasticsearch output to load dashboards:
sudo filebeat setup -E output.logstash.enabled=false -E output.elasticsearch.hosts=['localhost:9200'] -E setup.kibana.host=localhost:5601
After a few minutes, you should see something like this:
Output
Overwriting ILM policy is disabled. Set `setup.ilm.overwrite:true` for enabling.

Index setup finished.
Loading dashboards (Kibana must be running and reachable)
Loaded dashboards
Setting up ML using setup --machine-learning is going to be removed in 8.0.0. Please use the ML app instead.
See more: https://www.elastic.co/guide/en/elastic-stack-overview/current/xpack-ml.html
Loaded machine learning job configurations
Loaded Ingest pipelines
You can now start and enable Filebeat:
sudo systemctl start filebeat
sudo systemctl enable filebeat
After you have configured your Elastic Stack correctly, Filebeat will begin shipping your syslog and authorization logs to Logstash, which will then load that data into Elasticsearch.
Use the following command to search the Filebeat index to see if Elasticsearch is actually receiving this data:
curl -XGET 'http://localhost:9200/filebeat-*/_search?pretty'
You should get something like this:
Output
. . .
{
  "took" : 4,
  "timed_out" : false,
  "_shards" : {
    "total" : 2,
    "successful" : 2,
    "skipped" : 0,
    "failed" : 0
  },
  "hits" : {
    "total" : {
      "value" : 4040,
      "relation" : "eq"
    },
    "max_score" : 1.0,
    "hits" : [
      {
        "_index" : "filebeat-7.17.2-2022.04.18",
        "_type" : "_doc",
        "_id" : "YhwePoAB2RlwU5YB6yfP",
        "_score" : 1.0,
        "_source" : {
          "cloud" : {
            "instance" : {
              "id" : "294355569"
            },
            "provider" : "digitalocean",
            "service" : {
              "name" : "Droplets"
            },
            "region" : "tor1"
          },
          "@timestamp" : "2022-04-17T04:42:06.000Z",
          "agent" : {
            "hostname" : "elasticsearch",
            "name" : "elasticsearch",
            "id" : "b47ca399-e6ed-40fb-ae81-a2f2d36461e6",
            "ephemeral_id" : "af206986-f3e3-4b65-b058-7455434f0cac",
            "type" : "filebeat",
            "version" : "7.17.2"
          },
. . .
Elasticsearch is not loading any logs under the index you looked for if your output indicates 0 total hits, and you should check your configuration for errors. Go to the following step if you obtained the expected output, in which we will see how to navigate around some of Kibana's dashboards.
Step 5 - Exploring Kibana Dashboards
Let us go back to the Kibana web interface that we previously installed.
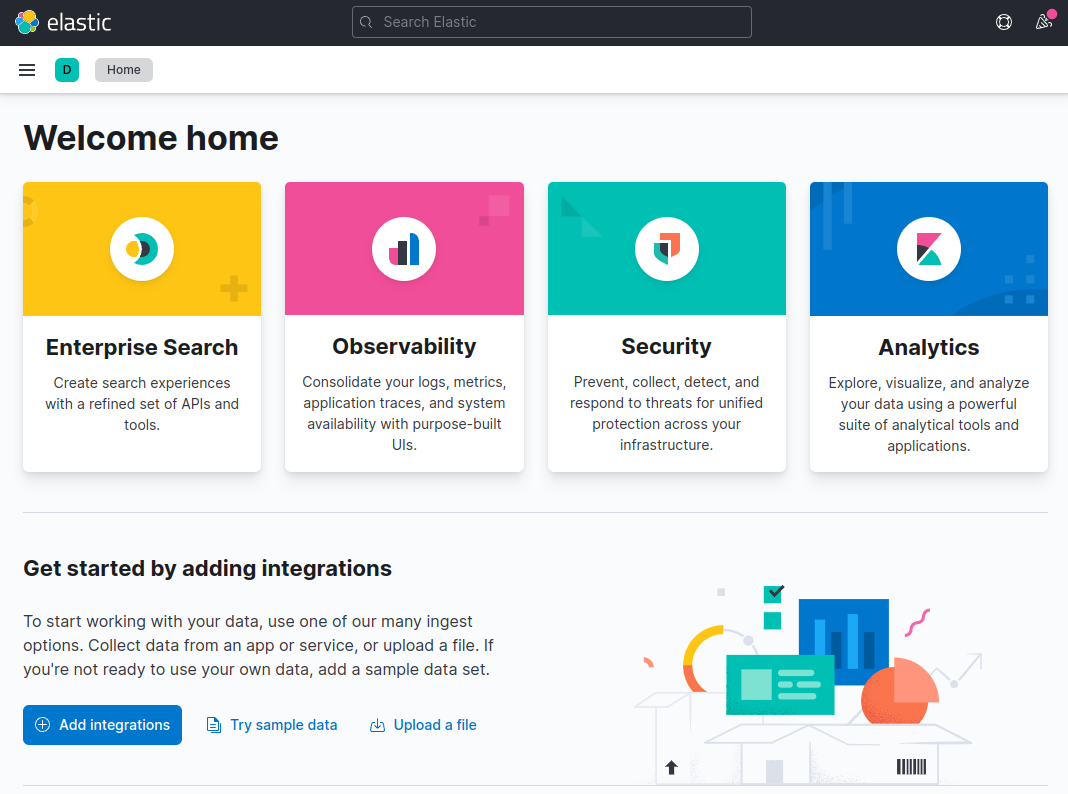
Go to your Elastic Stack server's FQDN or public IP address in a web browser. You must re-enter the credentials you defined in Step 2 if your session has been interrupted. You should see the Kibana homepage after logging in:
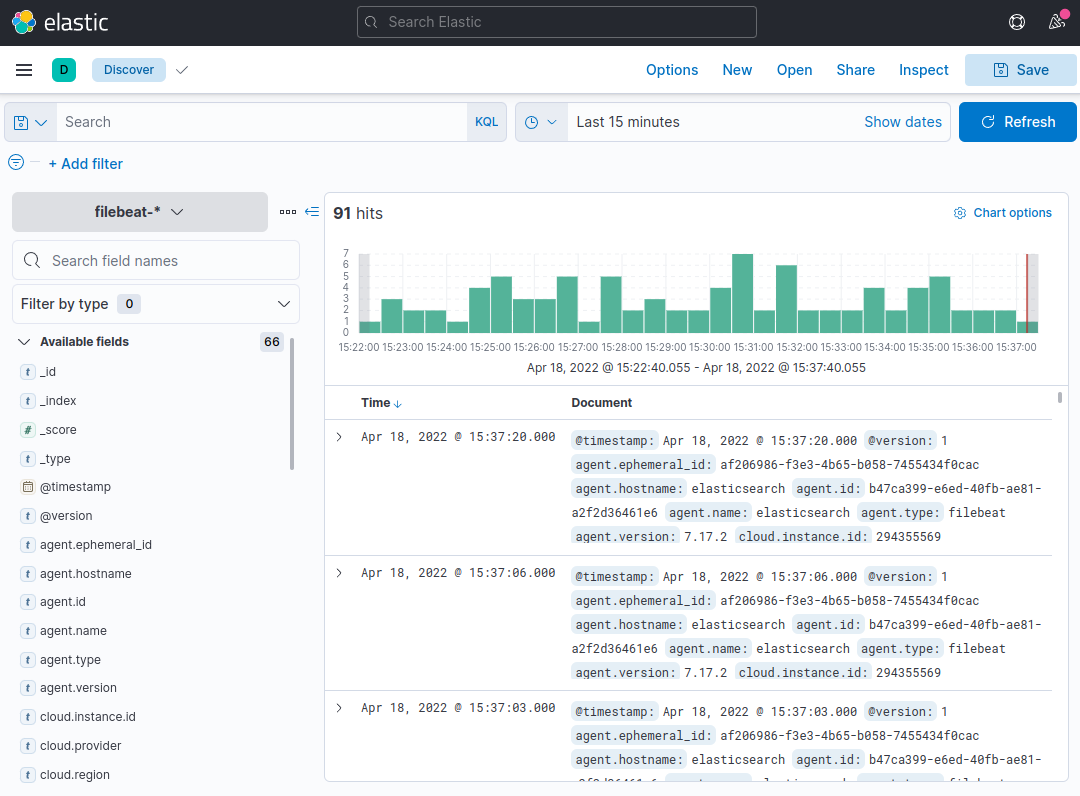
On the navigation bar on the left, select the Discover link (you may have to click the the Expand icon at the very bottom left to see the navigation menu items). To view Filebeat data, choose the predefined filebeat-* index pattern on the Discover page. By default, this will display all the log data from the previous 15 minutes. The log events will appear in a histogram, and some log messages below:
You may search and view your logs here, as well as modify your dashboard. Nevertheless, there will not be much in there at this moment because you are only collecting syslogs from your Elastic Stack server.
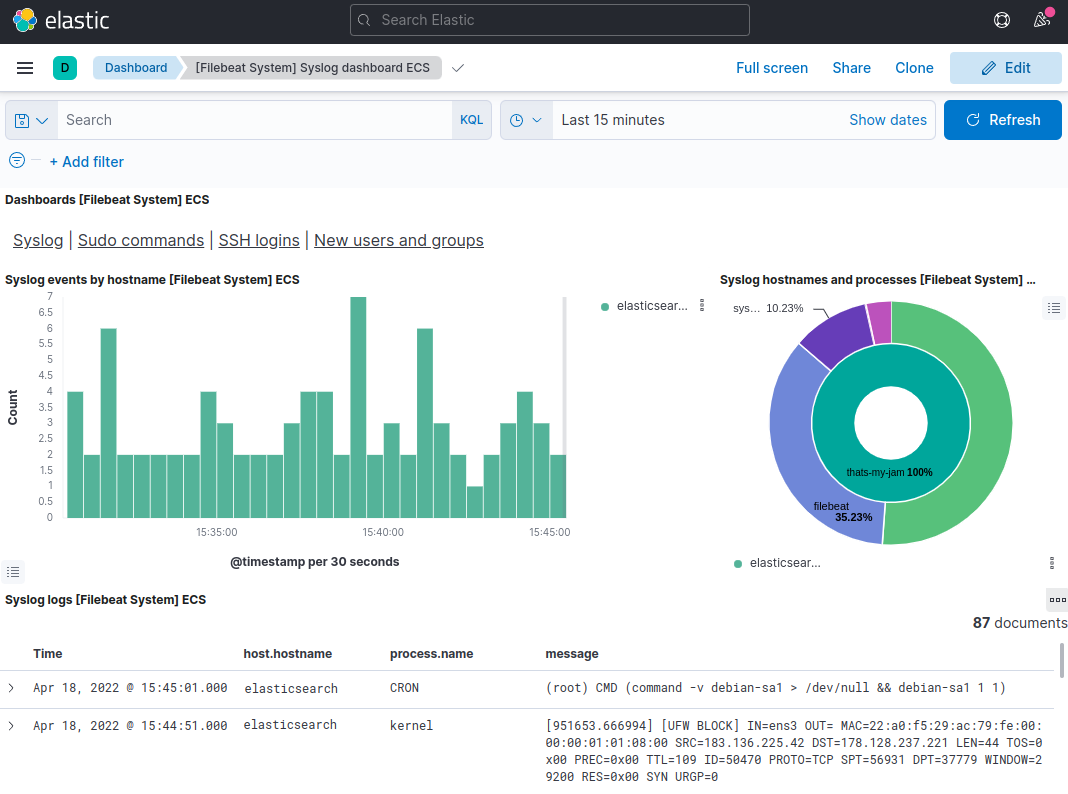
To access the Dashboard page and look for the Filebeat System dashboards, use the left-hand panel. You can choose from the sample dashboards that are included with Filebeat's system module once you get there.
You can, for example, check detailed statistics based on your syslog messages:
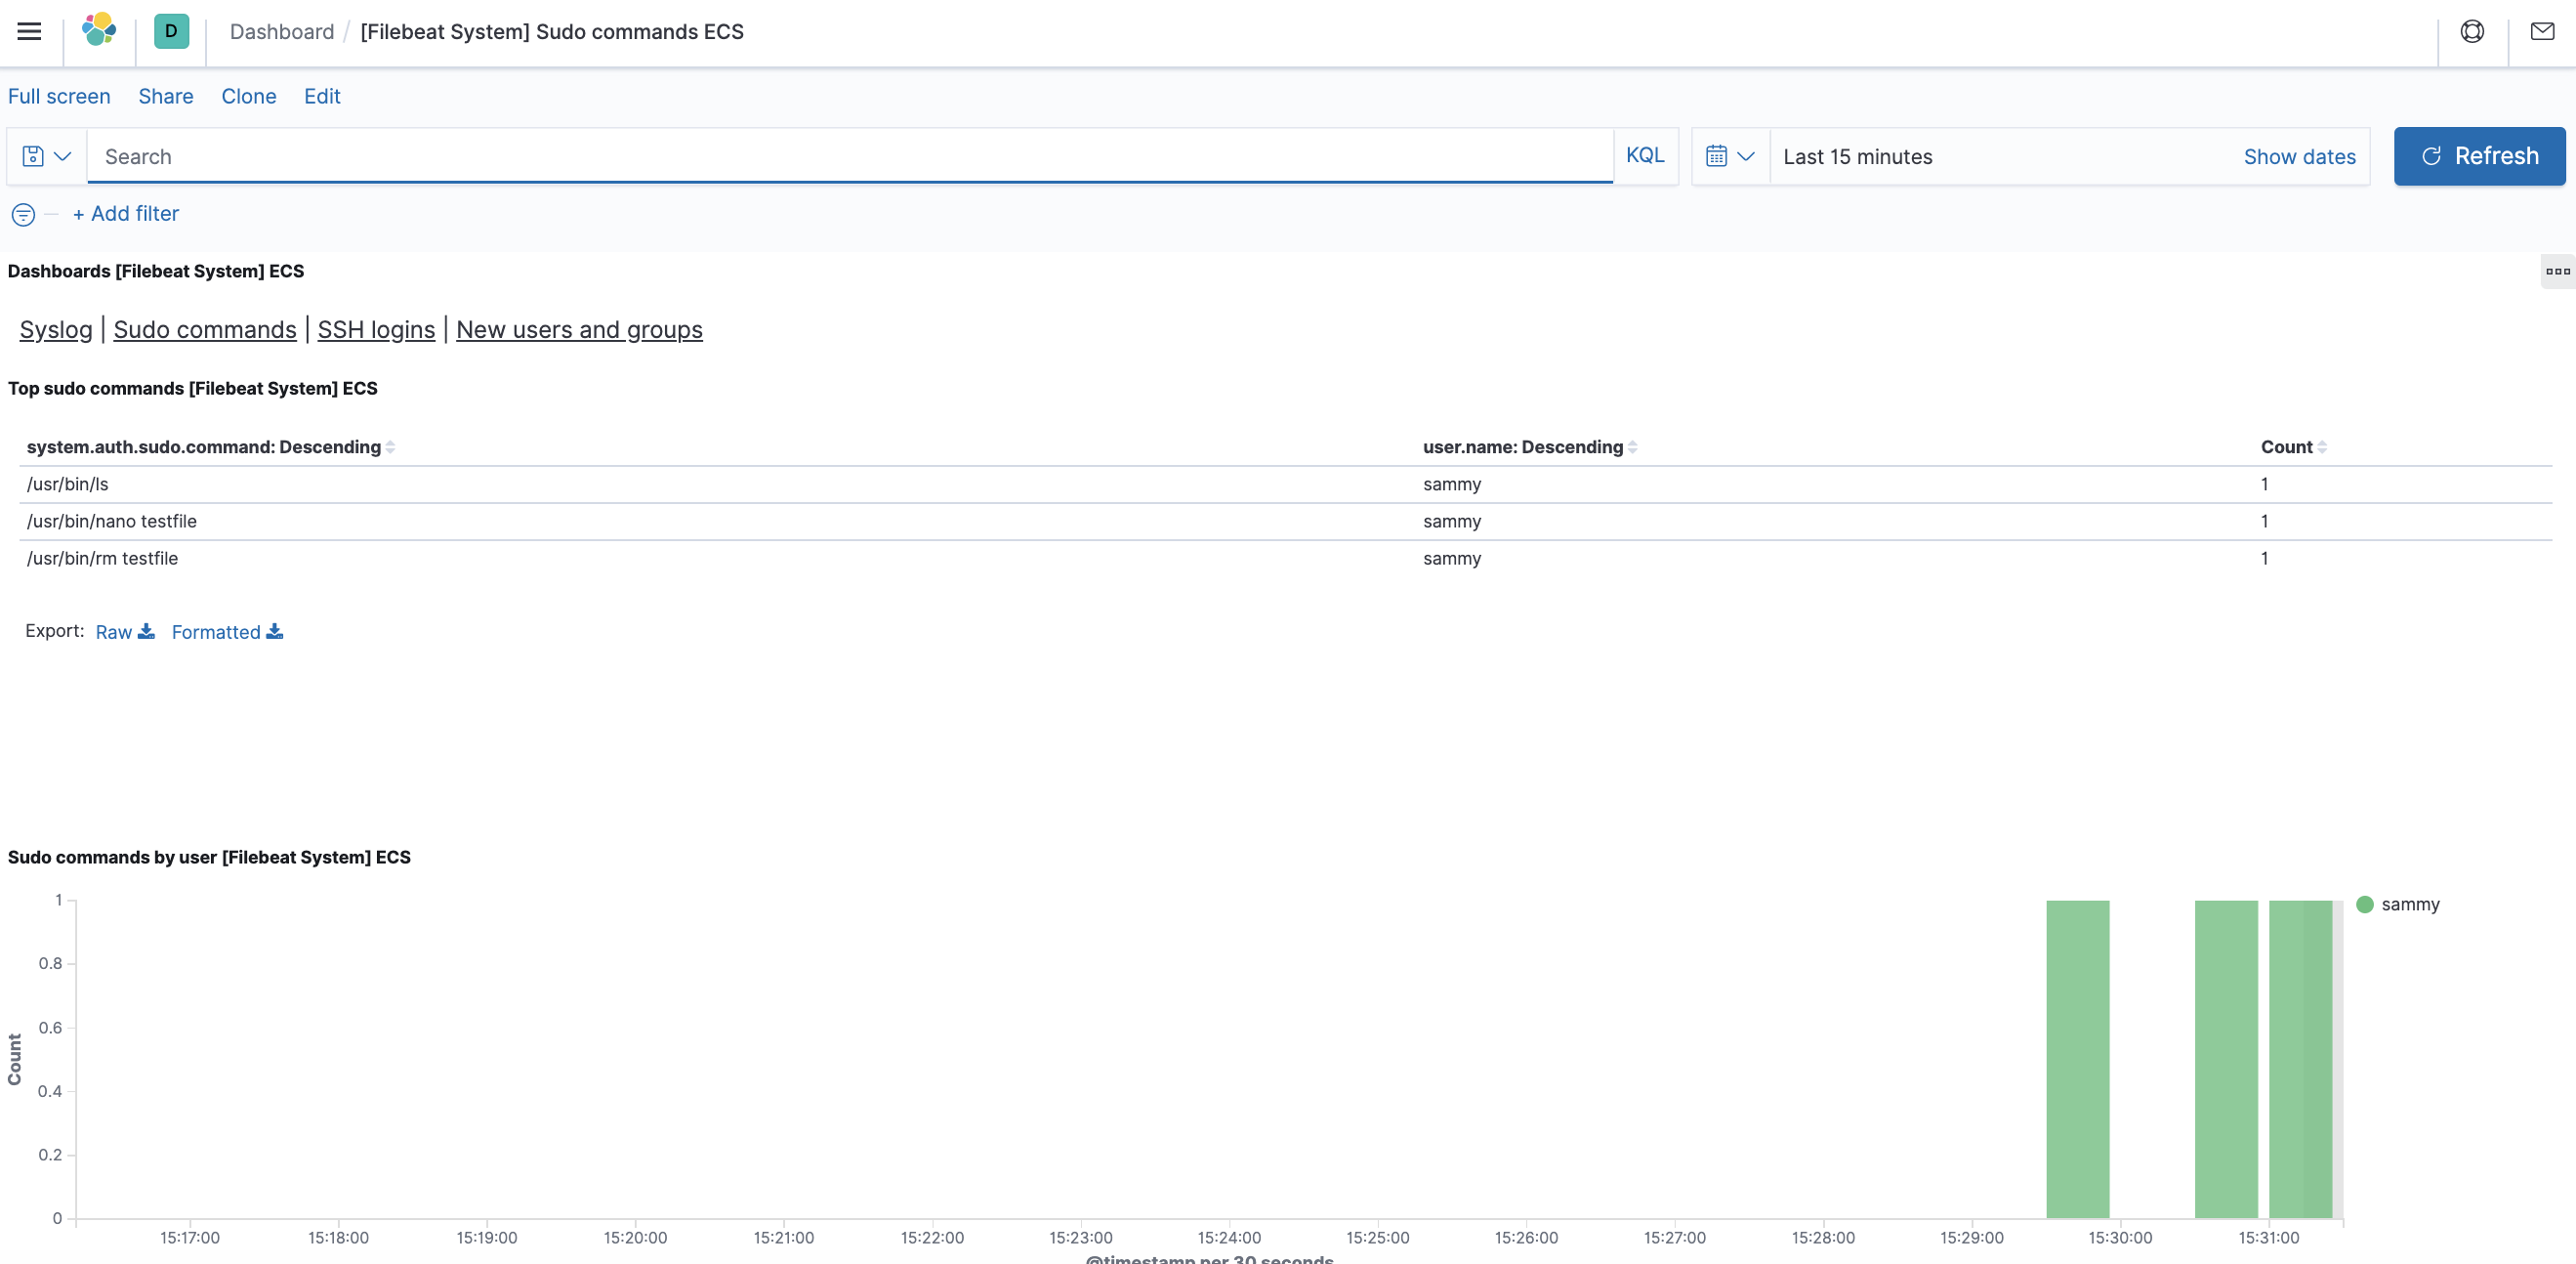
You can also see who has used the sudo command and when:
Kibana includes many more functions, such as graphing and filtering, so feel free to explore.
FAQs to Install Elasticsearch, Logstash, and Kibana (Elastic Stack) on Ubuntu 22.04
What are the system requirements for installing Elastic Stack on Ubuntu 22.04?
Elastic Stack requires a 64-bit operating system with at least 4 GB of RAM and a minimum of 2 CPU cores for optimal performance.
Is there a specific order in which I should install Elasticsearch, Logstash, and Kibana?
While there is no strict order, it is generally recommended to install Elasticsearch first, followed by Logstash and then Kibana for optimal integration and functionality.
Are there any additional dependencies required for Elastic Stack installation on Ubuntu 22.04?
Elastic Stack has minimal dependencies, but it's important to ensure Java Runtime Environment (JRE) is installed and properly configured before installing Elasticsearch, Logstash, and Kibana.
How can I start and stop Elasticsearch, Logstash, and Kibana services on Ubuntu 22.04?
Elastic Stack services can be managed using the systemd service manager. You can start, stop, and restart the services using specific commands, as described in the Elastic documentation.
Where can I find the configuration files for Elasticsearch, Logstash, and Kibana on Ubuntu 22.04?
The configuration files for Elastic Stack components can usually be found in their respective installation directories. The documentation provides details on locating and modifying these files.
How do I access the Kibana web interface after installation on Ubuntu 22.04?
Once Kibana is installed and running, you can access its web interface by opening a web browser and navigating to "http://localhost:5601" or the appropriate IP address of your Ubuntu server.
Is it possible to secure Elastic Stack components with authentication and access control?
Yes, Elastic Stack provides various security features, such as authentication, role-based access control, and encryption, to secure your installation. The Elastic documentation offers detailed guidance on configuring and managing security in Elastic Stack.
Conclusion
We hope this detailed tutorial helped you understand how to install Elasticsearch, Logstash, and Kibana (ELK Stack) on Ubuntu 22.04.
If you have any suggestions or queries, kindly leave them in the comments section.