
Choose a different version or distribution
Introduction
Before we begin talking about how to install Prometheus on Debian 11, let's briefly understand – What is Prometheus?
Prometheus is a powerful open-source monitoring and alerting system widely used in IT environments. It helps track and analyze the performance of various components in real-time, including servers, applications, and networks. With its flexible data model and robust querying language, Prometheus enables efficient data collection and visualization.
It also offers advanced features like alerting, graphing, and data exporting, making it a popular choice for managing complex infrastructure. By providing valuable insights into system health and performance, Prometheus empowers organizations to optimize their operations and ensure smooth functioning.
In this tutorial, you will install Prometheus on Debian 11. We will also address a few FAQs on how to install Prometheus on Debian 11.
Advantages of Prometheus
- Powerful Monitoring: Prometheus offers a robust monitoring solution, providing a comprehensive view of system health, performance, and error detection.
- Flexible Query Language: Its PromQL allows users to easily query and analyze metrics, enabling efficient debugging and troubleshooting.
- Alerting and Alert Management: With built-in alerting capabilities, Prometheus enables proactive monitoring and notification of critical issues, ensuring prompt actions can be taken.
- Scalability and Auto-Discovery: It seamlessly scales horizontally and supports auto-discovery of targets, making it suitable for dynamic and large-scale environments.
- Active Community and Ecosystem: Prometheus boasts an enthusiastic community and a rich ecosystem of integrations, exporters, and plugins, ensuring support and continuous improvement.
Steps to Install Prometheus on Debian 11 Bullseye Linux
The steps outlined here have been carried out on Debian 11, however, they can also be applied to Debian 10 Buster, Ubuntu 20.04, or 22.04 Linux.
1. Add a new system user
To restrict some rights, we install Prometheus as a new system user rather than our current user.
A group called Prometheus should be added first:
sudo groupadd --system prometheus
Add a user now, but give them no access to the group you created earlier.
sudo useradd -s /sbin/nologin --system -g prometheus prometheus
2. Create a user directory for Prometheus
Make a folder to store the files needed to execute Prometheus.
sudo mkdir /var/lib/prometheus
3. Download Prometheus Monitoring for Debian 11
In addition to the simple Docker installation, Prometheus is also available in archive format for download and installation on Debian or other Linux systems. The user can go to the download page on the website to get the most recent version, or employ the command-line approach:
curl -s https://api.github.com/repos/prometheus/prometheus/releases/latest|grep browser_download_url|grep linux-amd64|cut -d '"' -f 4|wget -qi -
When the file is on your machine, extract it as follows:
To see a list of every file in the current directory:
ls
tar -xvf prometheus-2.45.0.linux-amd64.tar.gz
Add the files we extracted to the newly formed directory:
sudo mv prometheus-2.45.0.linux-amd64 /etc/prometheus
Give the newly formed Prometheus user permission to access directories now:
sudo chown prometheus:prometheus /etc/prometheus
sudo chown prometheus:prometheus /var/lib/prometheus
sudo chown -R prometheus:prometheus /etc/prometheus/consoles
sudo chown -R prometheus:prometheus /etc/prometheus/console_libraries
4. Configure Prometheus files and script
Let's set up a few of its scripts and tools by copying them into the system user's bin directory.
sudo cp /etc/prometheus/prometheus /usr/local/bin/
sudo cp /etc/prometheus/promtool /usr/local/bin/
5. Install Prometheus Systemd Service on Debian 11
Let's construct a systemd service file for this monitoring tool so that it may start and operate automatically in the background as a system service once the setup and settings for installing Prometheus on Debian or Ubuntu are complete.
Make a file; if Nano isn't already installed, download it –sudo apt install nano -y.
sudo nano /etc/systemd/system/prometheus.service
Copy-paste the following lines:
[Unit]
Description=Prometheus
Documentation=https://prometheus.io/docs/introduction/overview/
Wants=network-online.target
After=network-online.target
[Service]
User=prometheus
Group=prometheus
Type=simple
ExecStart=/usr/local/bin/prometheus \
--config.file /etc/prometheus/prometheus.yml \
--storage.tsdb.path /var/lib/prometheus/ \
--web.console.templates=/etc/prometheus/consoles \
--web.console.libraries=/etc/prometheus/console_libraries

[Install]
WantedBy=multi-user.target
Save the file by pressing Ctrl+O, then Enter, and then Ctrl+X to leave.
6. Start and enable Prometheus
Once the service file has been generated, let's start it in the background and enable it so that it will run whenever the system boots up or when it crashes.
sudo systemctl daemon-reload
sudo systemctl enable --now prometheus
Check the status of service:
systemctl status prometheus
7. Access the web interface
Let's browse the web interface of the monitoring service now that we have verified that it is operating effectively on our system.
Open any browser that can connect to the IP address of your Debian 11 server or any other Linux server that is comparable.
Go to http://server-ip-address:9090.
sudo ufw allow 9090
8. Search metric and find Graph
You would have the Web interface of Prometheus once you completed the prior steps. Now enter the "metrics" you wish to search for in the search box. Visit the official documentation for further information.
9. How to install Node_exporter Prometheus on Linux
Installing Prometheus Node Exporter on other Linux system hardware allows you to monitor it.
So far, we have only deployed the server; however, in order to obtain metrics from other target systems, we must declare their IP addresses in the prometheus.yml file. That is demonstrated here later.
Let's assume that we need to monitor five systems throughout the network.
Install Node_Exporter first on each of the five Linux computers you wish to track by transmitting data to a Prometheus server. Whereas Node Exporter is intended for exporting machine metrics in the same way as other exporters are accessible for servers running MySQL, haproxy_exporter, graphite_exporter, and others.
Therefore, using the provided commands, we must configure Node_Exporter to gather the metrics. This process is the same for all Linux distributions, RPM or Debian-based.
1. Download Node Exporter
curl -s https://api.github.com/repos/prometheus/node_exporter/releases/latest| grep browser_download_url|grep linux-amd64|cut -d '"' -f 4|wget -qi -
2. Extract the file you just downloaded:
tar -xvf node_exporter-*.linux-amd64.tar.gz
3. Transfer the Node exporter service file to the bin:
sudo mv node_exporter-*.linux-amd64/node_exporter /usr/local/bin/
4. To run the Node Exporter service, create a user:
sudo useradd -rs /bin/false node_exporter
5. Make a systemd service file:
Create a service file in order to execute the Node exporter as a background system service:
sudo nano /etc/systemd/system/node_exporter.service
Copy and paste the subsequent lines:
[Unit]
Description=Node Exporter
After=network.target

[Service]
User=node_exporter
Group=node_exporter
Type=simple
ExecStart=/usr/local/bin/node_exporter

[Install]
WantedBy=multi-user.target
Press Ctrl+O to save the file, hit Enter, and Ctrl+X to exit.
sudo setenforce permissive
6. Activate and launch the service.
Let's set it to operate in the background now:
sudo systemctl daemon-reload
sudo systemctl enable --now node_exporter
Check Status:
systemctl status node_exporter
7. Firewall port 9100 should be opened
1. For Debian or Ubuntu
sudo ufw allow 9100
2. For Redhat, AlmaLinux, Rocky Linux, and other RPM-based systems:
sudo firewall-cmd --zone=public --add-port=9100/tcp --permanent
sudo firewall-cmd --reload
3. Add the IP address of the target machine to the prometheus.yml server
Edit the YML file on your Debian or Ubuntu server that is executing the Prometheus server command line.
Edit the YML file in Prometheus if you have five systems to monitor, specifically:
sudo nano /etc/prometheus/prometheus.yml
Append the following:
- job_name: 'node_exporter_metrics'
   scrape_interval: 5s
   static_configs:
     - targets: ['192.168.1.37:9100','192.168.1.36:9100','192.168.1.37:9100']
Add the IP addresses of the machines you wish to monitor in the format specified in the Targets.
Save the file by pressing Ctrl+O, then Enter, and then Ctrl+X to leave.
1. Check whether Prometheus YMKL is still valid.
Now we need to verify that the YML file we modified is correct and free of syntax errors.
promtool check config /etc/prometheus/prometheus.yml
2. Start the Prometheus Server again
sudo systemctl restart prometheus
Check the status of the service as well:
systemctl status prometheus
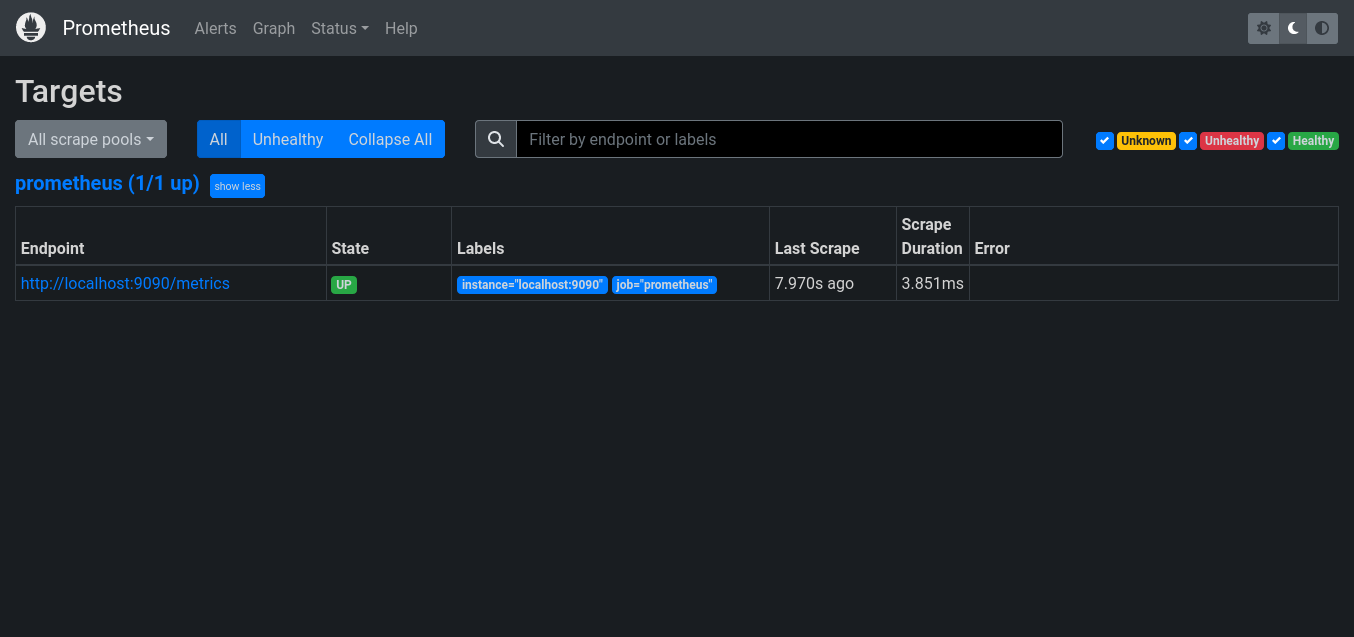
8. Track the target machine in Prometheus web UI
Visit the web interface by opening the browser once more and navigating to http:server-ip-adderess:9090/targets.
FAQs to Install Prometheus on Debian 11
Where can I find the Prometheus configuration file in Debian 11?
The Prometheus configuration file is located at /etc/prometheus/prometheus.yml.
How do I configure Prometheus to monitor my applications?
Open the Prometheus configuration file (/etc/prometheus/prometheus.yml) and define the targets you want to monitor under the scrape_configs section. Each target should specify the hostname and port of the application or service you want to monitor.
How can I enable alerting in Prometheus?
To enable alerting in Prometheus, you need to configure alert rules in the Prometheus configuration file. Define the rules under the rule_files section and specify the conditions and actions to trigger alerts.
How do I start and stop the Prometheus service in Debian 11?
You can start the Prometheus service using the command: sudo systemctl start prometheus. To stop the service, use: sudo systemctl stop prometheus.
Can I access Prometheus from a remote machine?
By default, Prometheus binds to the loopback interface, allowing access only from the local machine. If you want to access Prometheus from a remote machine, you need to modify the configuration file and update the --web.listen-address flag to bind to the desired IP address.
How can I upgrade Prometheus to a newer version in Debian 11?
To upgrade Prometheus to a newer version, you can use the package manager to update the Prometheus package: sudo apt update && sudo apt upgrade prometheus. This will fetch and install the latest available version.
Can I integrate Prometheus with other monitoring tools or dashboards on Debian 11?
Yes, Prometheus offers integrations with various monitoring tools and dashboards. Grafana is a popular choice for visualizing Prometheus metrics, and it can be easily integrated with Prometheus on Debian 11.
Conclusion
You may now begin monitoring and scraping metrics from all the Target Linux computers that have been added. This was a brief tutorial on how to build up the Prometheus server on Debian 11 bullseye and Target machines to retrieve metrics data.
If you have any queries, feel free to drop a comment below, and we'll be happy to help.