
Choose a different version or distribution
Introduction
Before we begin talking about how to install Prometheus on Ubuntu 20.04, let’s briefly understand - What Prometheus is?
Prometheus is a powerful open-source monitoring and alerting system widely used in IT environments. It helps track and analyze the performance of various components in real-time, including servers, applications, and networks. With its flexible data model and robust querying language, Prometheus enables efficient data collection and visualization.
It also offers advanced features like alerting, graphing, and data exporting, making it a popular choice for managing complex infrastructure. By providing valuable insights into system health and performance, Prometheus empowers organizations to optimize their operations and ensure smooth functioning.
In this tutorial, we will look at the installation of Prometheus on Ubuntu 20.04.
Advantages of Prometheus
- Real-time monitoring: Prometheus provides real-time monitoring of servers, applications, and networks, allowing organizations to promptly identify and address performance issues.
- Flexible data model: Its flexible data model enables efficient data collection and easy customization of metrics, making it adaptable to various monitoring needs.
- Powerful querying language: With a robust querying language, Prometheus allows users to retrieve and analyze data effectively, gaining valuable insights into system performance.
- Alerting system: Prometheus offers an advanced alerting system, enabling timely notifications and proactive management of critical events or anomalies.
- Extensive ecosystem: Its rich ecosystem includes a wide range of integrations, exporters, and visualization tools, enhancing its functionality and ease of use for diverse monitoring tasks.
Prerequisites to Install Prometheus on Ubuntu 20.04
- Have one Ubuntu 20.04 server, including a sudo non-root user and a firewall too.
- Nginx installed in your server.
Step 1 - Creating the Service Users
1) For security purposes, you will create two new user accounts, prome and node_exporter. It will let you isolate the ownership of Prometheus’ core files and directories. Now, create two users. Use the --no-create-home and --shell /bin/false options, so these users cannot log in to the server:
sudo useradd --no-create-home --shell /bin/false prometheus
sudo useradd --no-create-home --shell /bin/false node_exporter
2) Before downloading Prometheus binaries, create necessary directories for storing Prometheus files and data as well. Follow standard Linux conventions, and create a directory in /etc. It will enable Prometheus configuration files and a directory /var/lib for its data:
sudo mkdir /etc/prometheus
sudo mkdir /var/lib/prometheus
3) Next, set the user and group ownership on new directories to the Prometheus-user, by:
sudo chown prometheus:prometheus /etc/prometheus
sudo chown prometheus:prometheus /var/lib/prometheus
4) With users and directories in place, now you will download Prometheus. Then, create a minimal configuration file, to run Prometheus for the first time.
Step 2 - Download Prometheus
1) You will now download and unpack the current version of Prometheus into the home directory. Find the latest binaries with their checksums on the Prometheus download page:
cd ~
curl -LO https://github.com/prometheus/prometheus/releases/download/v2.0.0/prometheus-2.0.0.linux-amd64.tar.gz
2) Next, use sha256sum command. It will generate a checksum of the downloaded file, by:
sha256sum prometheus-2.0.0.linux-amd64.tar.gz
3) After that, compare the output from this command with the checksum on the Prometheus download page. You will need to ensure, that your file is genuine and not corrupt:
Output

e12917b25b32980daee0e9cf879d9ec197e2893924bd1574604eb0f550034d46  prometheus-2.0.0.linux-amd64.tar.gz
4) Also, if the checksums do not match, you will remove the downloaded file. Then, repeat the earlier steps to re-download the file. Now, unpack the downloaded archive using the below command:
tar xvf prometheus-2.0.0.linux-amd64.tar.gz
5) This will create a directory named, prometheus-2.0.0.linux-amd64. It contains two binary files (prometheus and promtool), and consoles. Also, console_libraries directories containing the web-interface files, license, a notice, and a few example files. Next, copy these two binaries to the /usr/local/bin directory:
sudo cp prometheus-2.0.0.linux-amd64/prometheus /usr/local/bin/
sudo cp prometheus-2.0.0.linux-amd64/promtool /usr/local/bin/
6) You will now set the user and group ownership on binaries to the Prometheus user:
sudo chown prometheus:prometheus /usr/local/bin/prometheus
sudo chown prometheus:prometheus /usr/local/bin/promtool
7) Then, copy the consoles and console_libraries directories to the /etc/prometheus:
sudo cp -r prometheus-2.0.0.linux-amd64/consoles /etc/prometheus
sudo cp -r prometheus-2.0.0.linux-amd64/console_libraries /etc/prometheus
8) Again, set the user and group ownership on directories to the Prometheus user. Use the -R flag. It will ensure the ownership is set on files inside the directory too:
sudo chown -R prometheus:prometheus /etc/prometheus/consoles
sudo chown -R prometheus:prometheus /etc/prometheus/console_libraries
9) At last, remove the leftover files from the home directory. These files are no longer necessary:
rm -rf prometheus-2.0.0.linux-amd64.tar.gz prometheus-2.0.0.linux-amd64
10) Next, after Prometheus installation, create configuration and service files in preparation for the first run.
Step 3 - Configuring the Prometheus
1) In the /etc/prometheus directory, use nano or your favorite text editor. It will create a configuration file as prometheus.yml. This file will contain enough information to run Prometheus the first time:
sudo nano /etc/prometheus/prometheus.yml
2) Now, in global-settings, define default intervals for the scraping metrics. Also, the Prometheus will apply these settings to every exporter. So, unless an individual exports own settings override the globals:
global:
  scrape_interval: 15s
The scrape_interval value indicates Prometheus collects metrics from its exporters every 15-seconds. It is long enough for most of the exporters.
3) Next, add Prometheus itself to the list of exporters. It will scrape from the following scrape_configs directive:
...
scrape_configs:
  - job_name: 'prometheus'
    scrape_interval: 5s
    static_configs:
      - targets: ['localhost:9090']
Prometheus uses job_name to label the exporters in queries and on graphs, be sure to pick something explanatory here. Further, Prometheus exports necessary data about itself. It will let you can use it for monitoring performance and debugging. In addition, Prometheus uses both static_configs and targets directives to know where exporters are running. Although, this particular exporter is running on the same server as Prometheus itself. So, you will use localhost instead of IP-address along with default-port, 9090.
The configuration file will now look like below:
global:
  scrape_interval: 15s

scrape_configs:
  - job_name: 'prometheus'
    scrape_interval: 5s
    static_configs:
      - targets: ['localhost:9090']
4) You will need to save the file and exit the text editor.
5) Set the user and group ownership on the configuration file to Prometheus user:
sudo chown prometheus:prometheus /etc/prometheus/prometheus.yml
6) After, the configuration is complete, you are ready to test Prometheus by running it for the first time.
Step 4 - Running the Prometheus
1) Now, start the Prometheus as a Prometheus user and provide the path to both configuration file as well as the data directory:
sudo -u prometheus /usr/local/bin/prometheus \
    --config.file /etc/prometheus/prometheus.yml \
    --storage.tsdb.path /var/lib/prometheus/ \
    --web.console.templates=/etc/prometheus/consoles \
    --web.console.libraries=/etc/prometheus/console_libraries
The output has the information about Prometheus loading progress, configuration file, and other relating services confirms that Prometheus is listening on the port 9090:
Output

level=info ts=2017-11-17T18:37:27.474530094Z caller=main.go:215 msg="Starting Prometheus" version="(version=2.0.0, branch=HEAD, re
vision=0a74f98628a0463dddc90528220c94de5032d1a0)"
level=info ts=2017-11-17T18:37:27.474758404Z caller=main.go:216 build_context="(go=go1.9.2, user=root@615b82cb36b6, date=20171108-
07:11:59)"
level=info ts=2017-11-17T18:37:27.474883982Z caller=main.go:217 host_details="(Linux 4.4.0-98-generic #121-Ubuntu SMP Tue Oct 10 1
4:24:03 UTC 2017 x86_64 prometheus-update (none))"
level=info ts=2017-11-17T18:37:27.483661837Z caller=web.go:380 component=web msg="Start listening for connections" address=0.0.0.0
:9090
level=info ts=2017-11-17T18:37:27.489730138Z caller=main.go:314 msg="Starting TSDB"
level=info ts=2017-11-17T18:37:27.516050288Z caller=targetmanager.go:71 component="target manager" msg="Starting target manager...
"
level=info ts=2017-11-17T18:37:27.537629169Z caller=main.go:326 msg="TSDB started"
level=info ts=2017-11-17T18:37:27.537896721Z caller=main.go:394 msg="Loading configuration file" filename=/etc/prometheus/promethe
us.yml
level=info ts=2017-11-17T18:37:27.53890004Z caller=main.go:371 msg="Server is ready to receive requests.
2) So, if you get an error message, you will need to double-check the used YAML syntax in your configuration file then, follow the on-screen instructions to solve the problem.
3) Now, halt the Prometheus by pressing CTRL+C and open a new systemd service file:
sudo nano /etc/systemd/system/prometheus.service
4) The service file indicates systemd to run Prometheus as Prometheus user. The location of the configuration file is in the /etc/prometheus/prometheus.yml directory. It stores its data in the /var/lib/prometheus directory. Now, copy the following content into the file:
Prometheus service file - /etc/systemd/system/prometheus.service
[Unit]
Description=Prometheus
Wants=network-online.target
After=network-online.target

[Service]
User=prometheus
Group=prometheus
Type=simple
ExecStart=/usr/local/bin/prometheus \
    --config.file /etc/prometheus/prometheus.yml \
    --storage.tsdb.path /var/lib/prometheus/ \
    --web.console.templates=/etc/prometheus/consoles \
    --web.console.libraries=/etc/prometheus/console_libraries

[Install]
WantedBy=multi-user.target
5) Next, save the file and close the text editor. To use the new service, reload systemd using the below command:
sudo systemctl daemon-reload
6) You will now start Prometheus using the below command:
sudo systemctl start prometheus
7) You will make sure Prometheus is running. Check service’s status, by:
sudo systemctl status prometheus
The output will tell you the Prometheus’ status. Also, the main process identifier (PID), memory use, and much more.
8) So, if the service’s status is not active then, follow the on-screen instructions. Further, re-trace the previous steps to solve the problem:
Output

● prometheus.service - Prometheus
   Loaded: loaded (/etc/systemd/system/prometheus.service; disabled; vendor preset: enabled)
   Active: active (running) since Fri 2017-07-21 11:40:40 UTC; 3s ago
 Main PID: 2104 (prometheus)
    Tasks: 7
   Memory: 13.8M
      CPU: 470ms
   CGroup: /system.slice/prometheus.service
...
9) When ready to move on, then press Q to quit the status command. Lastly, enable service to start on the boot, by:
sudo systemctl enable prometheus
Now, the Prometheus is running. You can install an additional exporter, it will generate metrics about the server’s resources.
Step 5 - Downloading the Node Exporter
1) You will need to expand Prometheus beyond metrics about itself only. Install an additional exporter known as Node-Exporter. It provides details about the system, the CPU, disk, and memory usage. Now, download the current version of node-exporter into your home directory. You will find the latest binaries along with their checksums on the Prometheus download page:
cd ~
curl -LO https://github.com/prometheus/node_exporter/releases/download/v0.15.1/node_exporter-0.15.1.linux-amd64.tar.gz
2) Next, use the sha256sum command, It will generate a checksum of the downloaded file:
sha256sum node_exporter-0.15.1.linux-amd64.tar.gz
3) Verify the downloaded file’s integrity. Do it by comparing its checksum with the one on download page:
Output

7ffb3773abb71dd2b2119c5f6a7a0dbca0cff34b24b2ced9e01d9897df61a127  node_exporter-0.15.1.linux-amd64.tar.gz
4) If the checksums do not match, you will need to remove the downloaded file and repeat the steps. Next, unpack the downloaded archive using the below command:
tar xvf node_exporter-0.15.1.linux-amd64.tar.gz
The above will create a directory known as node_exporter-0.15.1.linux-amd64. It contains a binary file named, node_exporter, a license, and a notice.
5) Then, copy the binary to /usr/local/bin directory. You will set the user and group ownership to node_exporter user:
sudo cp node_exporter-0.15.1.linux-amd64/node_exporter /usr/local/bin
sudo chown node_exporter:node_exporter /usr/local/bin/node_exporter
6) At last, remove the leftover files from your home directory as they are no longer needed:
rm -rf node_exporter-0.15.1.linux-amd64.tar.gz node_exporter-0.15.1.linux-amd64
7) After, installing Node Exporter, test it by running it. Do it before creating a service file for it, so that it starts on-boot.
Step 6 - Running the Node Exporter
1) The steps for running Node-Exporter are similar to running Prometheus. Now, start by creating systemd service file for the Node-Exporter:
sudo nano /etc/systemd/system/node_exporter.service
2) This service enables the system to run Node Exporter. Now, copy the below content into the service file:
Node Exporter service file - /etc/systemd/system/node_exporter.service
[Unit]
Description=Node Exporter
Wants=network-online.target
After=network-online.target

[Service]
User=node_exporter
Group=node_exporter
Type=simple
ExecStart=/usr/local/bin/node_exporter

[Install]
WantedBy=multi-user.target
3) The Collectors define which metrics the Node-Exporter will generate. You will then see Node-Exporter’s complete list of collectors. It also includes those enabled by default and also which are deprecated, in the Node-Exporter README file. If you need to override the default list of the collectors, use the--collectors.enabled flag:
Node Exporter service file part - /etc/systemd/system/node_exporter.service
...
ExecStart=/usr/local/bin/node_exporter --collectors.enabled meminfo,loadavg,filesystem
...
4) The above example tells Node-Exporter to generate metrics. It is basically using meminfo, loadavg, and filesystem collectors. It enables you to limit the collectors to a few or many. But, also note that there are no blank spaces before or after commas.
Next, save the file and close the text editor.
5) Then, reload systemd to use this new service:
sudo systemctl daemon-reload
6) You will now run Node-Exporter using the below command:
sudo systemctl start node_exporter
7) Then, verify that Node Exporter is running correctly with status command:
sudo systemctl status node_exporter
8) Again, the output tells you the Node-Exporter’s status. Along with the main process identifier (PID), memory usage, and much more, if the service’s status is not active then, follow the on-screen messages. Further, re-trace the previous steps to resolve the problem before continuing:
Output

● node_exporter.service - Node Exporter
   Loaded: loaded (/etc/systemd/system/node_exporter.service; disabled; vendor preset: enabled)
   Active: active (running) since Fri 2017-07-21 11:44:46 UTC; 5s ago
 Main PID: 2161 (node_exporter)
    Tasks: 3
   Memory: 1.4M
      CPU: 11ms
   CGroup: /system.slice/node_exporter.service
9) At last, enable Node-Exporter to start on boot using the below command:
sudo systemctl enable node_exporter
The Node Exporter configuration is now complete and running. You will then tell Prometheus to start scraping the new metrics.
Step 7 - Configuring the Prometheus to Scrape Node-Exporter
1) The Prometheus only scrapes exporters, defined in the scrape_configs portion of its configuration file. You will need to add an entry for Node-Exporter. So, open the configuration file using the below command:
sudo nano /etc/prometheus/prometheus.yml
2) Then, at the end of the scrape_configs block, add a new entry as node_exporter:
...
  - job_name: 'node_exporter'
    scrape_interval: 5s
    static_configs:
      - targets: ['localhost:9100']
3) Here, the exporter is also running on the same server as Prometheus. You can use localhost instead of an IP address. Again, along with the Node-Exporter's default port, 9100. The whole configuration file will look like below:
Prometheus config file - /etc/prometheus/prometheus.yml
global:
  scrape_interval: 15s

scrape_configs:
  - job_name: 'prometheus'
    scrape_interval: 5s
    static_configs:
      - targets: ['localhost:9090']
  - job_name: 'node_exporter'
    scrape_interval: 5s
    static_configs:
      - targets: ['localhost:9100']
4) Next, save the file and exit the text editor, when ready to continue. Finally, you can restart Prometheus for the changes to take action:
sudo systemctl restart prometheus
5) Again, verify that everything is running correctly. Do it with the status command:
sudo systemctl status prometheus
6) If the service status is not set to active, follow the on-screen instructions then, re-trace previous steps before moving on:
Output

● prometheus.service - Prometheus
   Loaded: loaded (/etc/systemd/system/prometheus.service; disabled; vendor preset: enabled)
   Active: active (running) since Fri 2017-07-21 11:46:39 UTC; 6s ago
 Main PID: 2219 (prometheus)
    Tasks: 6
   Memory: 19.9M
      CPU: 433ms
   CGroup: /system.slice/prometheus.service
7) Now, the installation and configuration of Prometheus and Node-Exporter is complete and running. Also, for a final precaution before connecting to the web interface, enhance the installation’s security with basic HTTP authentication. It will ensure that unauthorized users cannot access your metrics.
Step 8 - Securing Prometheus
1) Prometheus does not include built-in authentication, or another security mechanism. Also, it ensures high flexible system with fewer configuration restraints and ensures that your metrics and overall setup are properly secure. So, for simplicity you will use Nginx to add basic HTTP authentication to your installation. Prometheus and Grafana fully support it. You will start by installing apache2-utils, it will give you access tohtpasswd utility for generating the password files:
sudo apt-get update
sudo apt-get install apache2-utils
2) Next, create a password file by directing htpasswd to store the file and the username you like to use for authentication:
sudo htpasswd -c /etc/nginx/.htpasswd sammy
3) The result of the command is the creation of a new file named, .htpasswd. Its location is in the /etc/nginx directory. It contains the username and a hashed version of the password you enter.
4) Next, configure the Nginx to use the new passwords.
5) First, you will make a Prometheus-specific copy of the default Nginx configuration file. It will enable you to revert back to defaults later, in case a problem occurs:
sudo cp /etc/nginx/sites-available/default /etc/nginx/sites-available/prometheus
6) Now, open the new configuration file using the below command:
sudo nano /etc/nginx/sites-available/prometheus
7) Locate the location / block. It will be under the server block. It will look like this:
/etc/nginx/sites-available/default
...
    location / {
        try_files $uri $uri/ =404;
    }
...
8) Now you will forward all traffic to Prometheus. For that, replace the try_files directive with the below content:
...
    location / {
        auth_basic "Prometheus server authentication";
        auth_basic_user_file /etc/nginx/.htpasswd;
        proxy_pass http://localhost:9090;
        proxy_http_version 1.1;
        proxy_set_header Upgrade $http_upgrade;
        proxy_set_header Connection 'upgrade';
        proxy_set_header Host $host;
        proxy_cache_bypass $http_upgrade;
    }
...
9) The settings ensure that you will have to authenticate at the start of each new session. Moreover, the reverse proxy will direct all requests, handled by block to Prometheus.
10) After finishing to make changes, save the file and close the text editor.
11) Next, deactivate the default Nginx configuration file. Do it by removing the link in the /etc/nginx/sites-enabled directory. Then, activate the new configuration file by creating a link to it:
sudo rm /etc/nginx/sites-enabled/default
sudo ln -s /etc/nginx/sites-available/prometheus /etc/nginx/sites-enabled/
12) Before restarting Nginx, check the configuration for errors using the below command:
sudo nginx -t
13) The output should show that the syntax is ok and even test is successful. If you receive an error message, follow on-screen instructions, to fix the problem before proceeding further:
Output of Nginx configuration tests

nginx: the configuration file /etc/nginx/nginx.conf syntax is ok
nginx: configuration file /etc/nginx/nginx.conf test is successful
14) Then, reload the Nginx to incorporate all of the changes:
sudo systemctl reload nginx
15) Verify that Nginx is set up and running using the below command:
sudo systemctl status nginx
16) If the output does not show the service’s status is active, follow the on-screen messages then, re-trace the previous steps to resolve the issue before continuing:
Output
● nginx.service - A high performance web server and a reverse proxy server
   Loaded: loaded (/lib/systemd/system/nginx.service; enabled; vendor preset: en
   Active: active (running) since Mon 2017-07-31 21:20:57 UTC; 12min ago
  Process: 4302 ExecReload=/usr/sbin/nginx -g daemon on; master_process on; -s r
 Main PID: 3053 (nginx)
    Tasks: 2
   Memory: 3.6M
      CPU: 56ms
   CGroup: /system.slice/nginx.service
Now, you have a fully functional and secure Prometheus server. So, you will be able to log into the web interface and begin looking at the metrics.
Step 9 - Testing Prometheus
Prometheus gives a basic web interface for monitoring the status for its exporters, executing-queries, and generating-graphs. Here, you will use the built-in web interface to ensure that Prometheus and Node-Exporter are running.
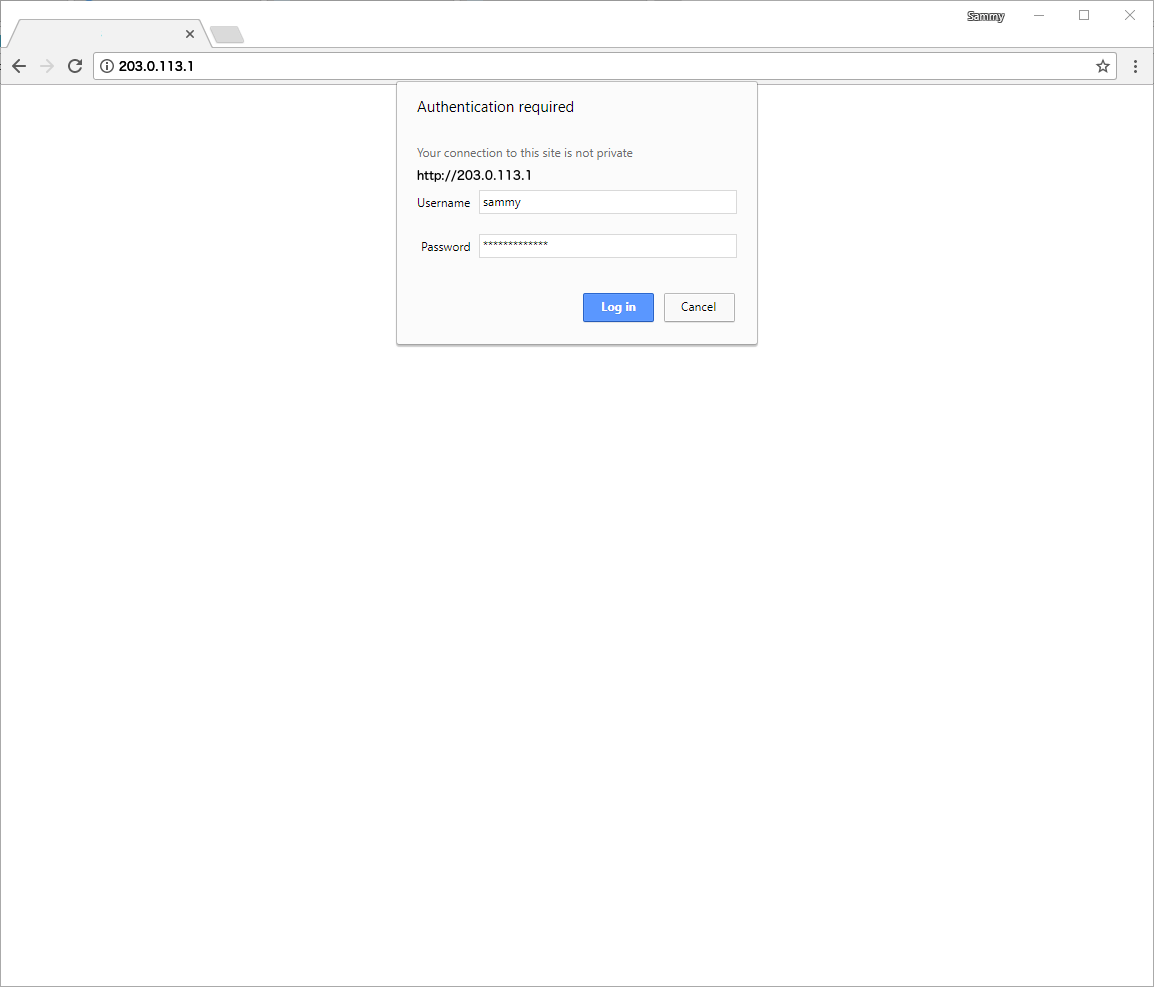
1) Firstly, point your web browser to http://your_server_ip.
2) Then, in the HTTP authentication dialogue box, enter your username and password.
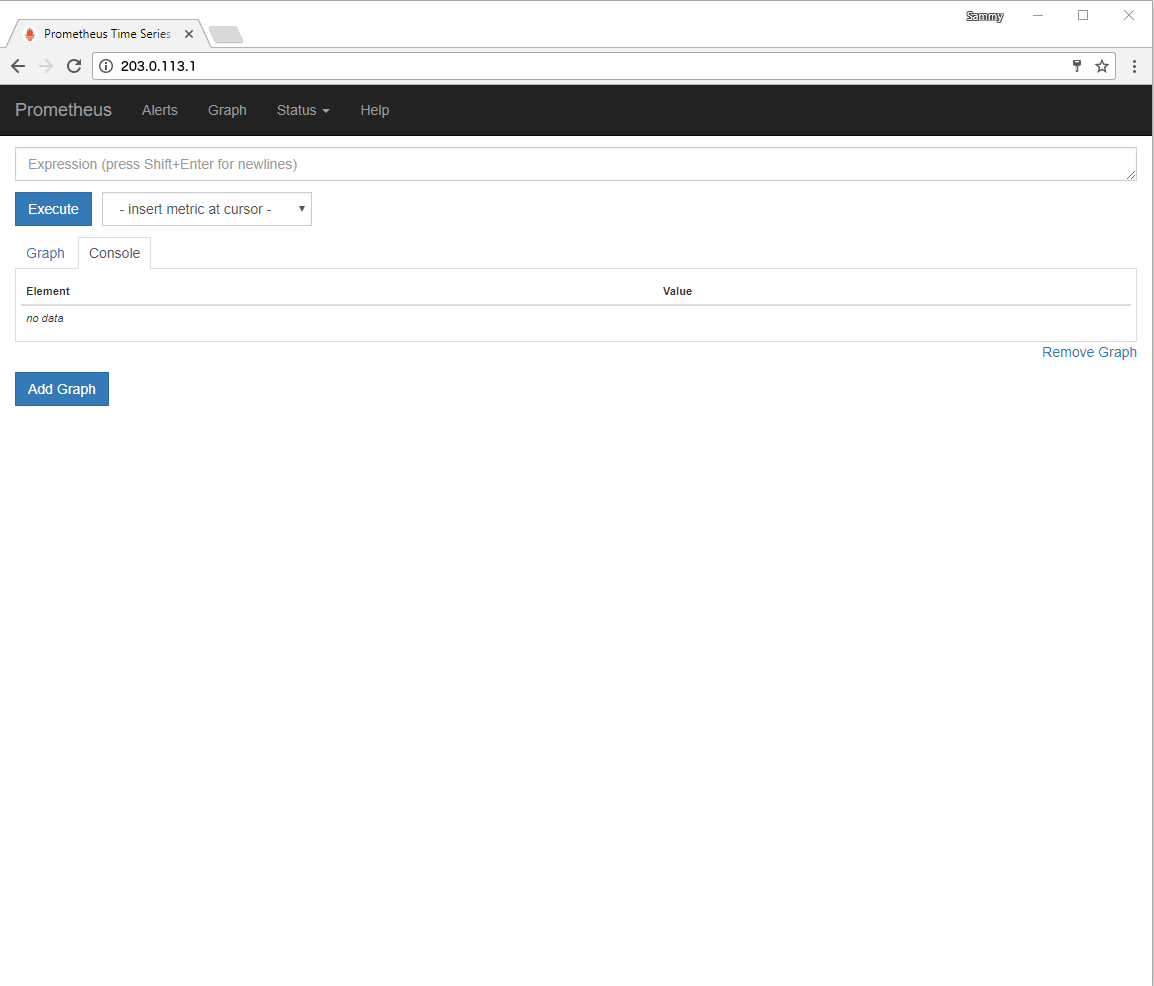
3) After login, you will see the Expression Browser. Here, execute and visualize the custom queries.
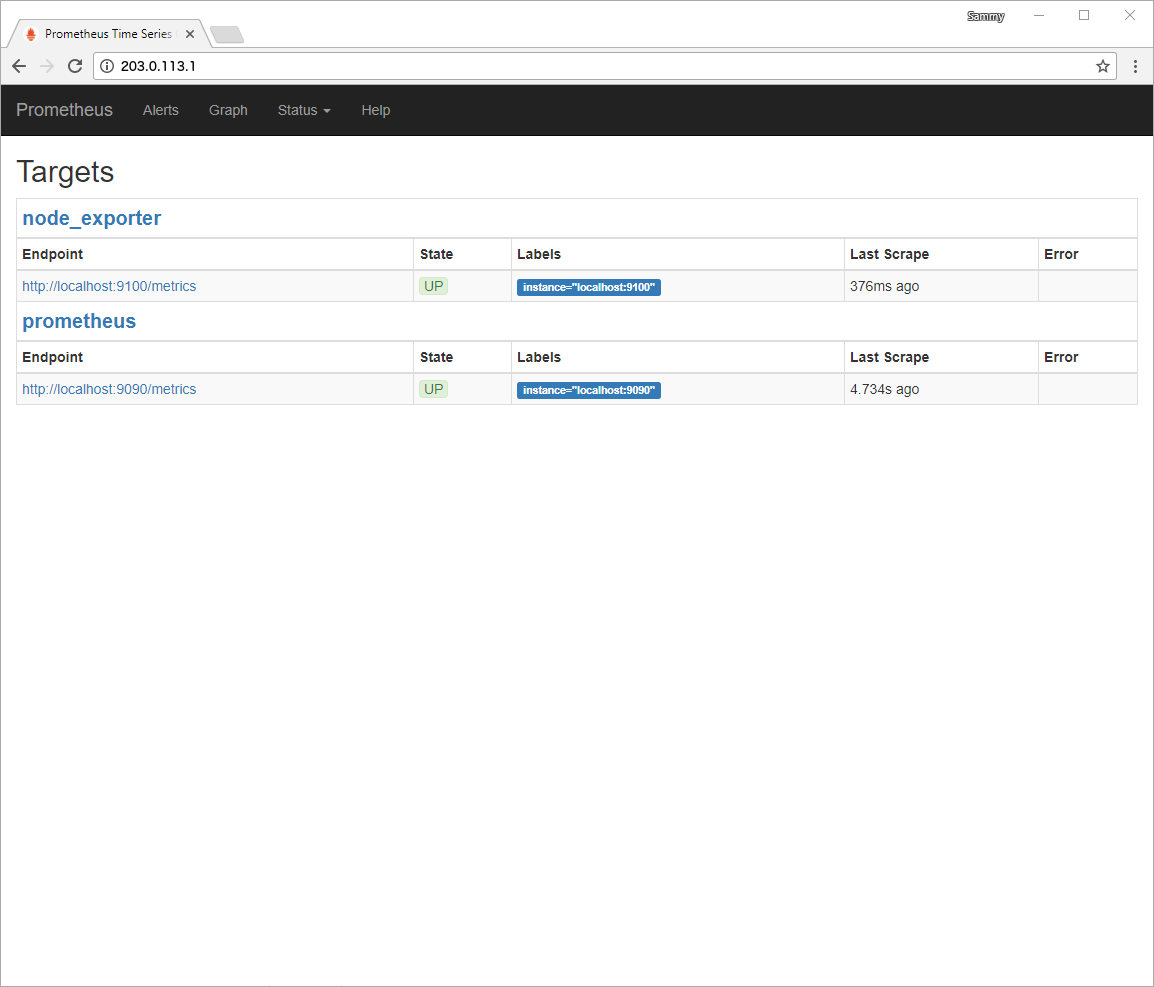
4) Before execution, verify the status of both Prometheus and Node-Explorer. Do it by clicking first on the Status menu at the top of the screen then click on the Targets menu option. You will be able to see both targets listed in UP state.
5) If either of the exporters is missing or displays an error message, check the service’s status with the below commands:
sudo systemctl status prometheus
6) The output for both services will report a status of Active: active (running). If a service is not active, or active but still not working correctly, follow the on-screen instructions. Next, re-trace the previous steps before continuing.
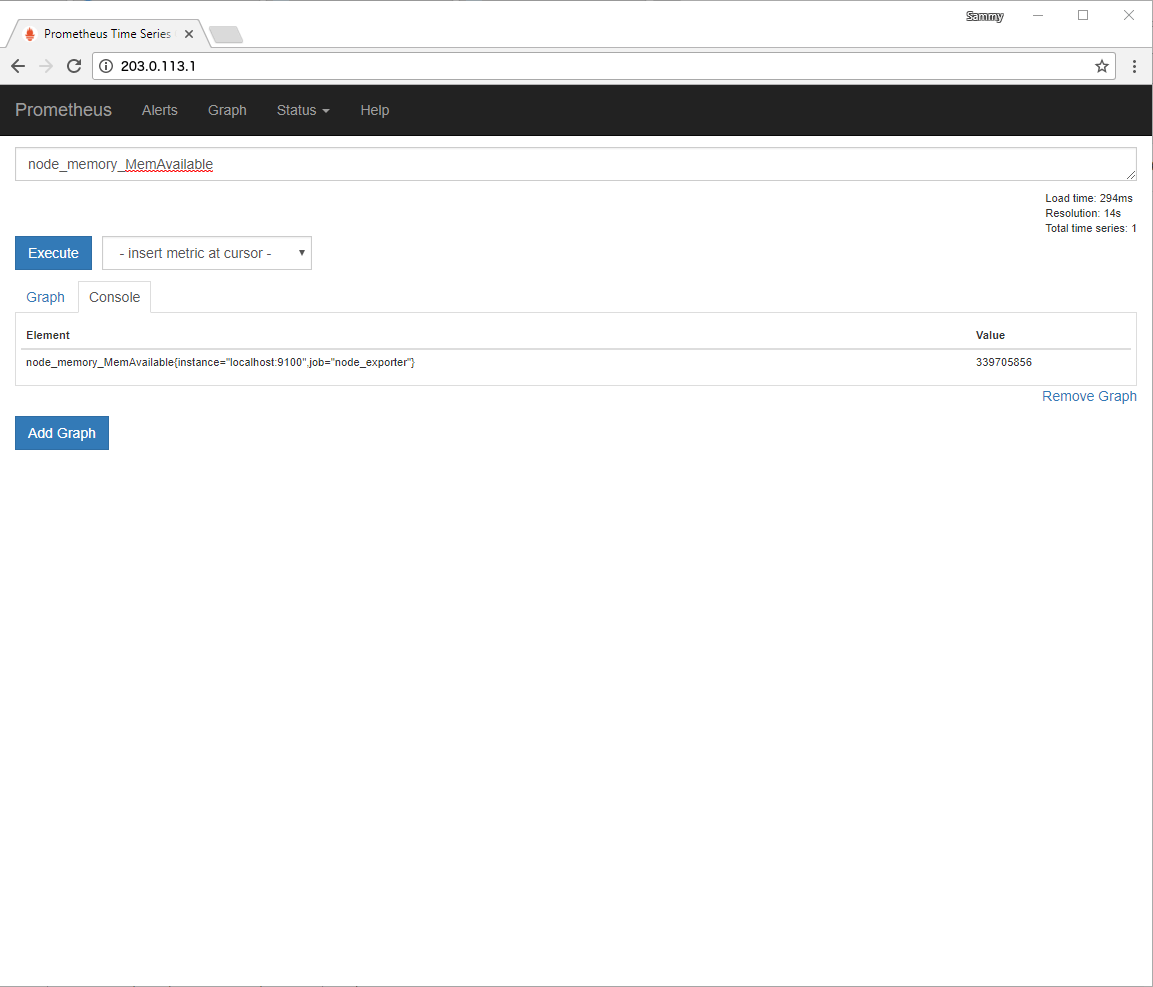
7) After that, make sure that the exporters are working correctly. You will execute a few expressions against the Node-Exporter. Click on the Graph menu at the top of the screen, it will return you to the Expression Browser.

8) Now, in the Expression field, type node_memory_MemAvailable. Next, press the Execute button, it will update the Console tab with the amount of memory your server has.
9) By default, the Node-Exporter reports this amount in bytes. To convert it to megabytes, use math operators to divide by 1024 twice. Additionally, in the Expression field, enter node_memory_MemAvailable/1024/1024. Then press the Execute button to continue.
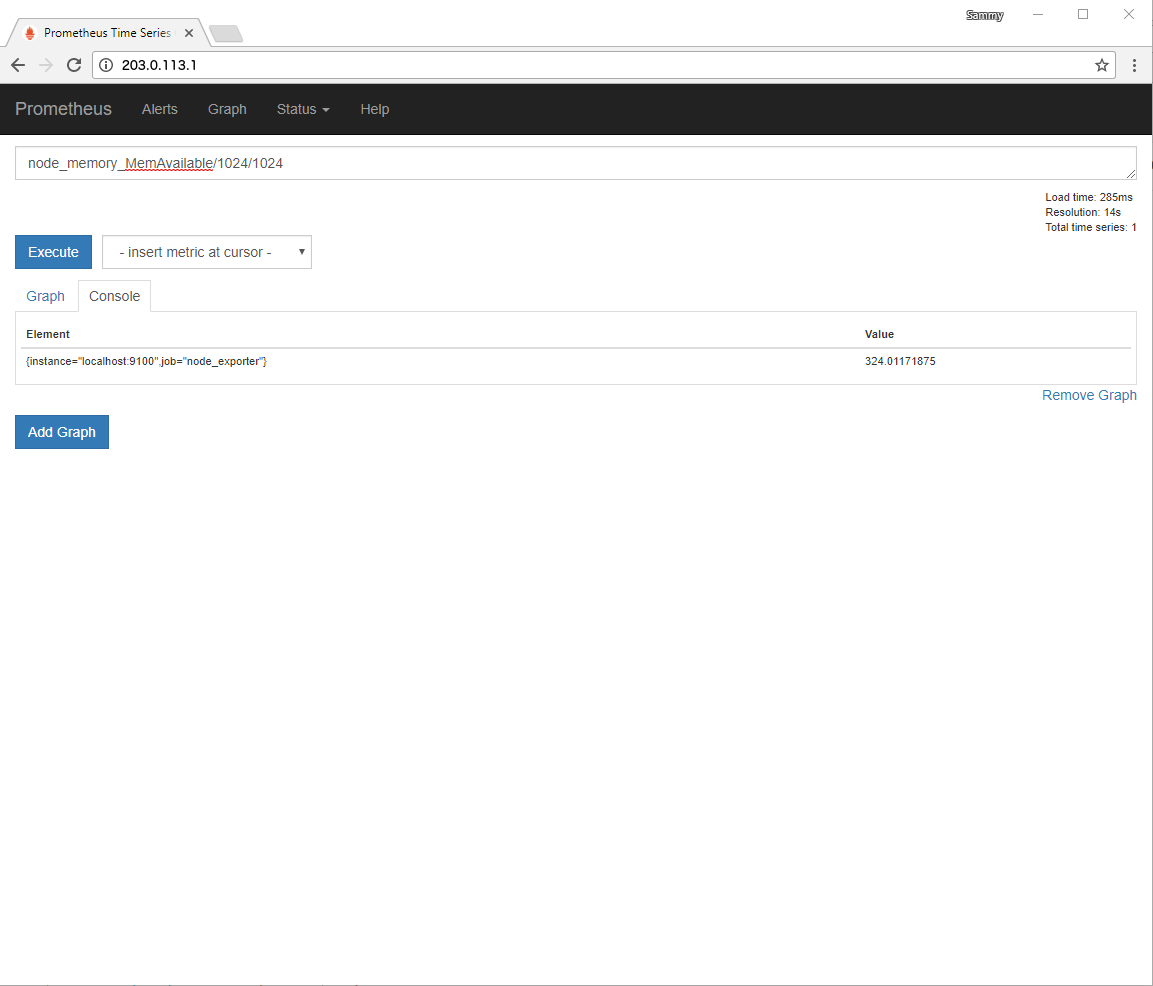
10) The Console tab here, will now display your results in megabytes. You can verify the results, by executingfree command from your terminal. The -h flag indicates, free to report back in a human-readable format. It gives us the amount in megabytes:
free -h
The output contains details about memory usage in the available column;
Output
              total        used        free      shared  buff/cache   available
Mem:           488M        144M         17M        3.7M        326M        324M
Swap:            0B          0B          0B
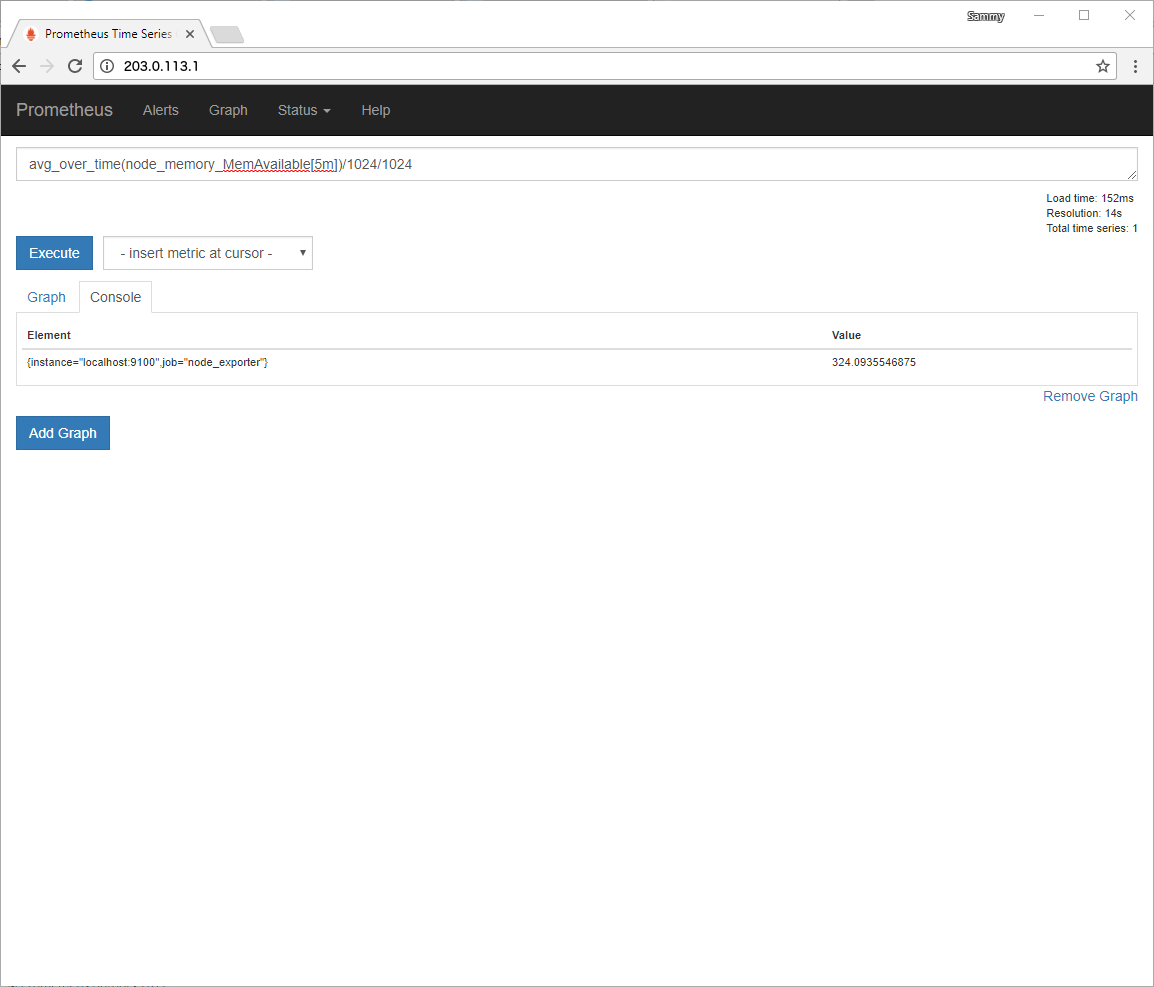
11) The Prometheus query language also gives many functions for aggregating the results. Next, in the Expression field, type avg_over_time(node_memory_MemAvailable[5m])/1024/1024 .
Now, click on the Execute button.
12) Then, click on the Graph tab. It will display executed expression as a graph instead of as text.
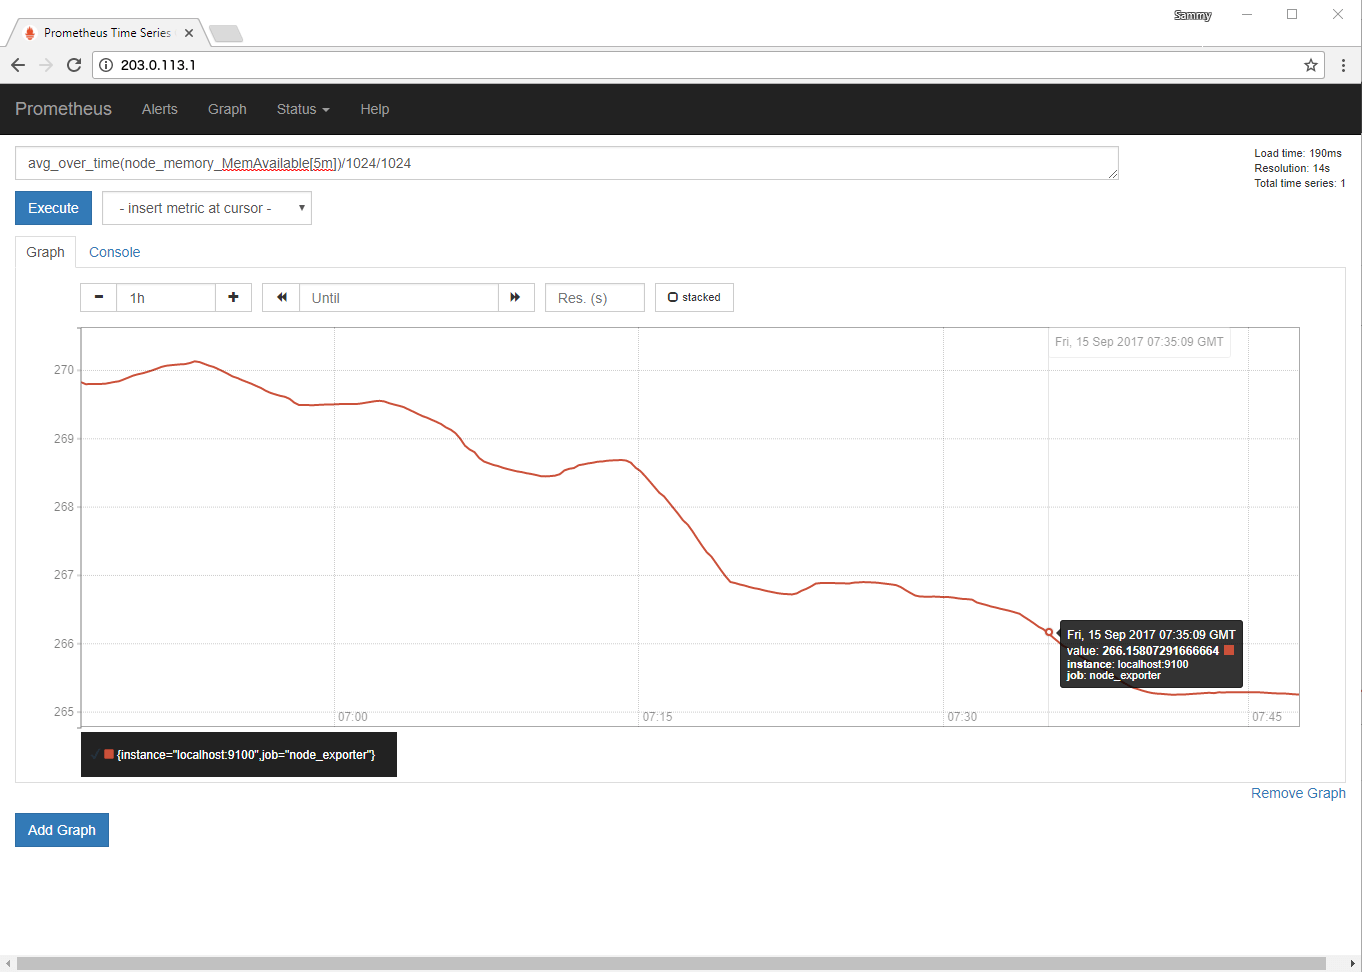
13) Finally, while still on this tab, hover your mouse over the graph for additional details. Further, details about any specific point along the graph’s X and Y-axis.
FAQs to Install Prometheus on Ubuntu 20.04
Where is Prometheus configuration file located on Ubuntu 20.04?
The Prometheus configuration file is typically located at /etc/prometheus/prometheus.yml on Ubuntu 20.04.
How do I enable Prometheus to start on system boot?
To enable Prometheus to start on system boot in Ubuntu 20.04, you can use the command: sudo systemctl enable prometheus
How can I access the Prometheus web interface?
The Prometheus web interface can be accessed by opening a web browser and navigating to http://localhost:9090. If Prometheus is running on a remote server, replace localhost with the server's IP address or hostname.
How do I configure Prometheus to monitor my applications?
To configure Prometheus to monitor your applications, you need to edit the prometheus.yml configuration file. You can define targets (endpoints) and specify the metrics you want to collect from each target.
How can I configure alerting with Prometheus on Ubuntu 20.04?
Alerting with Prometheus involves configuring alert rules and setting up an alert manager. You can define rules in the prometheus.yml file and configure the alert manager to send notifications via various channels like email, Slack, or PagerDuty.
How can I uninstall Prometheus from Ubuntu 20.04?
To uninstall Prometheus from Ubuntu 20.04, you can use the following command: sudo apt remove prometheus. This will remove the Prometheus package and its associated files from your system.
Conclusion
We hope this detailed tutorial helped you install Prometheus on Ubuntu 20.04.
If you have any queries, please leave a comment below and we’ll be happy to respond to them for sure.