

Choose a different version or distribution
Introduction
Before we begin talking about how to install Prometheus on Ubuntu 24.04, let's briefly understand – What is Prometheus?
Prometheus is a popular open-source monitoring and alerting solution designed to help track the performance and health of systems and applications. It gathers metrics and data from various sources, allowing users to visualize and analyze them in real-time.
Prometheus is highly flexible and integrates well with different tools and platforms, making it a valuable choice for monitoring complex environments. With its powerful features and active community support, Prometheus has become a go-to solution for ensuring the reliability and stability of software systems.
In this tutorial, you will install Prometheus on Ubuntu 24.04. We will also address a few FAQs on how to install Prometheus on Ubuntu 24.04.
Advantages of Prometheus
- Real-time Monitoring: Provides real-time insights into system performance.
- Scalability: Easily scales to monitor large, dynamic environments.
- Flexible Query Language: Allows complex data analysis.
- Alerting: Enables proactive issue detection and notification.
- Extensive Integrations: Seamlessly integrates with various tools and systems.
Install Prometheus on Ubuntu 24.04
Step 1:
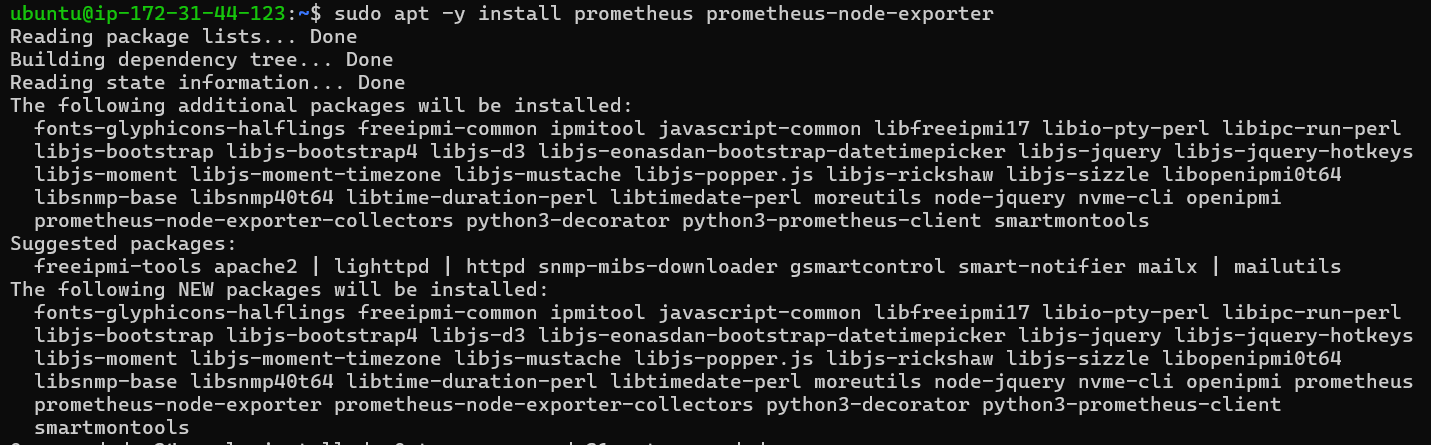
Set up the Prometheus Server and install [node-exporter] to collect metric data on system resources, such as CPU or memory usage.
sudo apt -y install prometheus prometheus-node-exporter
Step 2:
Set up the basic configurations in [prometheus.yml].
1. Open the prometheus.yml configuration file:
sudo cat /etc/prometheus/prometheus.yml
Output

# Sample config for Prometheus.

global:
  scrape_interval:     15s # Set the scrape interval to every 15 seconds. Default is every 1 minute.
  evaluation_interval: 15s # Evaluate rules every 15 seconds. The default is every 1 minute.
  # scrape_timeout is set to the global default (10s).

  # Attach these labels to any time series or alerts when communicating with
  # external systems (federation, remote storage, Alertmanager).
  external_labels:
      monitor: 'example'

# Alertmanager configuration
alerting:
  alertmanagers:
  - static_configs:
    - targets: ['localhost:9093']

# Load rules once and periodically evaluate them according to the global 'evaluation_interval'.
rule_files:
  # - "first_rules.yml"
  # - "second_rules.yml"

# A scrape configuration containing exactly one endpoint to scrape:
# Here it's Prometheus itself.
scrape_configs:
  # The job name is added as a label `job=` to any timeseries scraped from this config.
  - job_name: 'prometheus'

    # Override the global default and scrape targets from this job every 5 seconds.
    scrape_interval: 5s
    scrape_timeout: 5s

    # metrics_path defaults to '/metrics'
    # scheme defaults to 'http'.

    static_configs:
      - targets: ['localhost:9090']

  - job_name: node
    # If prometheus-node-exporter is installed, grab stats about the local
    # machine by default.
    static_configs:
      - targets: ['localhost:9100']
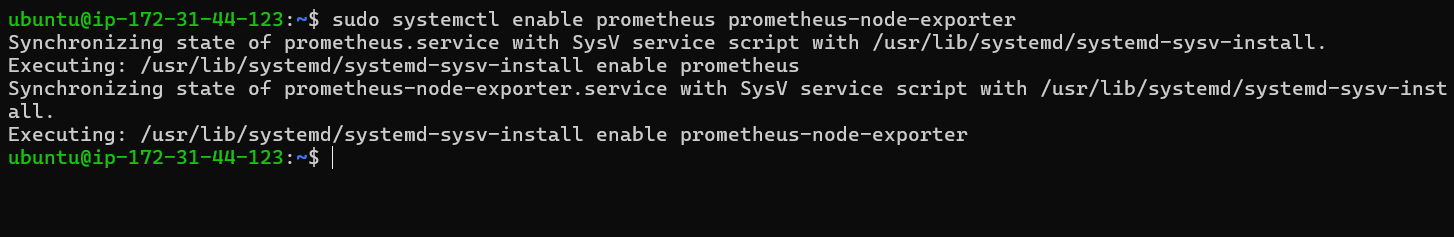
Configure system services on Linux to start automatically at boot
sudo systemctl enable prometheus prometheus-node-exporter
Step 3:
From a client host, access [http://(Prometheus server's hostname or IP address):9090/]. The Prometheus Web UI will appear as shown below.
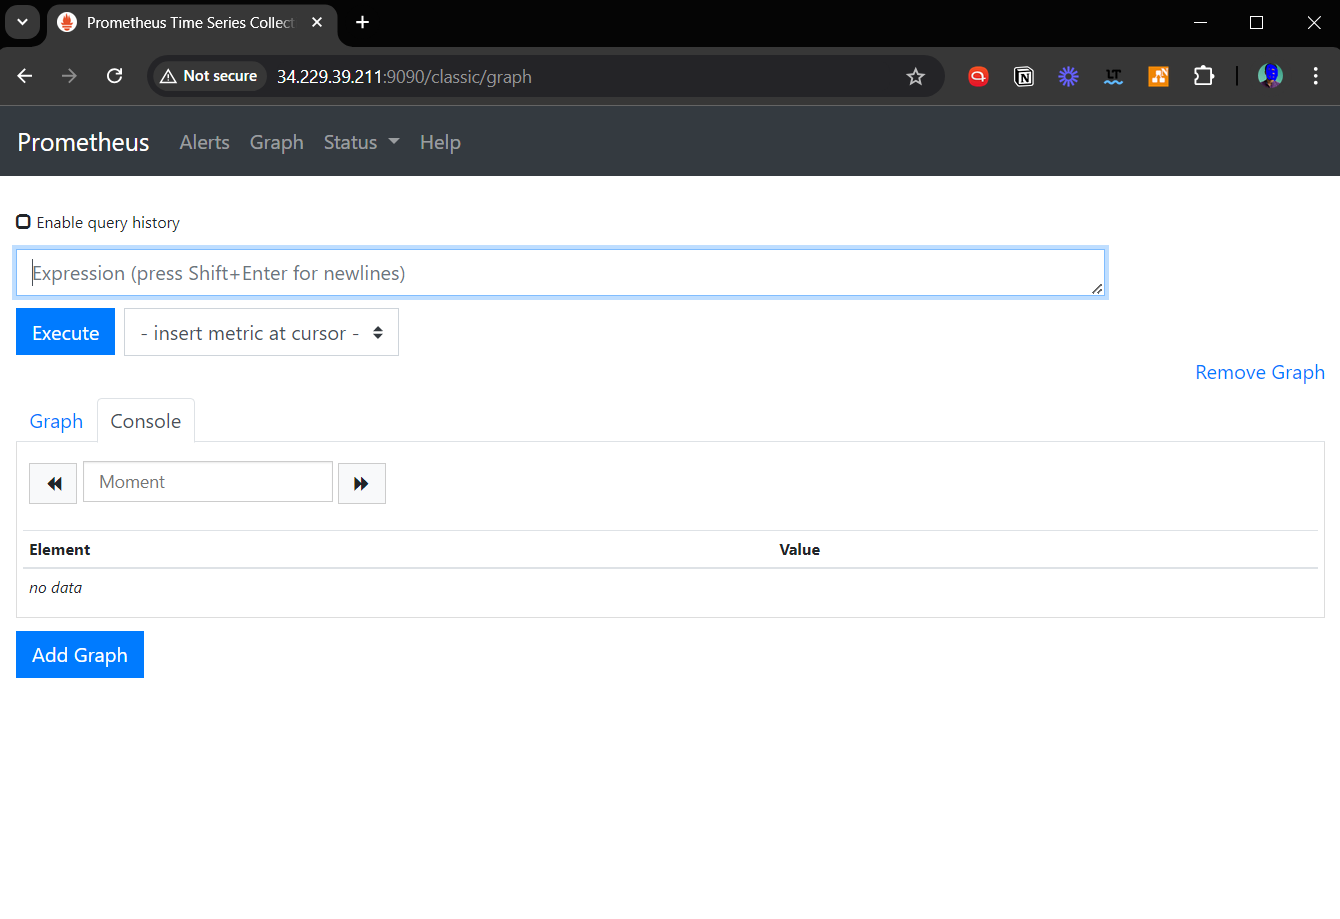
Step 4:
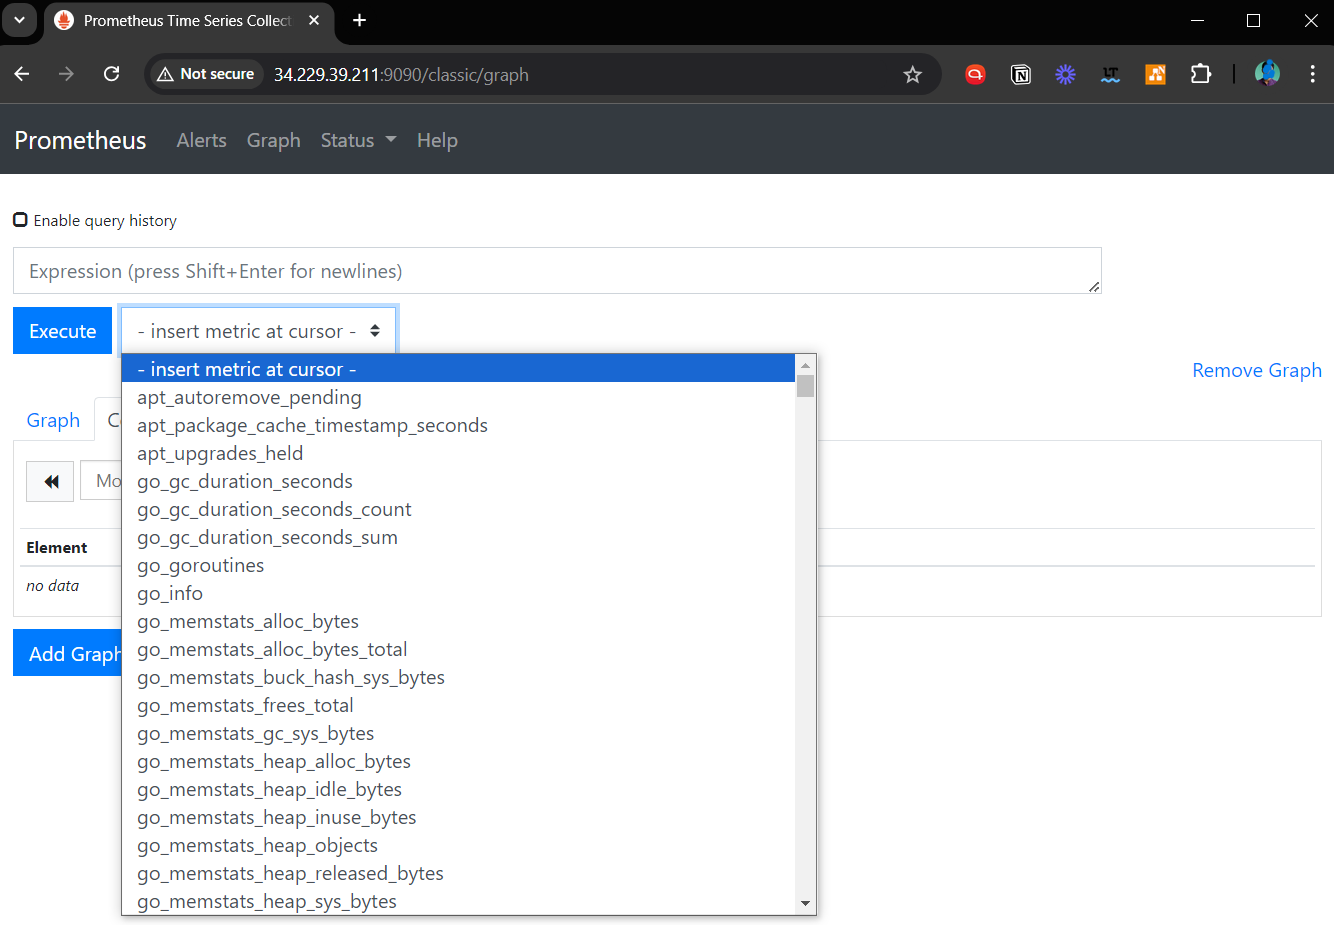
Click on [insert metric at cursor] to view various time series data queries. You can also directly input queries in the form above using Prometheus [Expression Language].
Refer to the official document about usage of Expression Language.
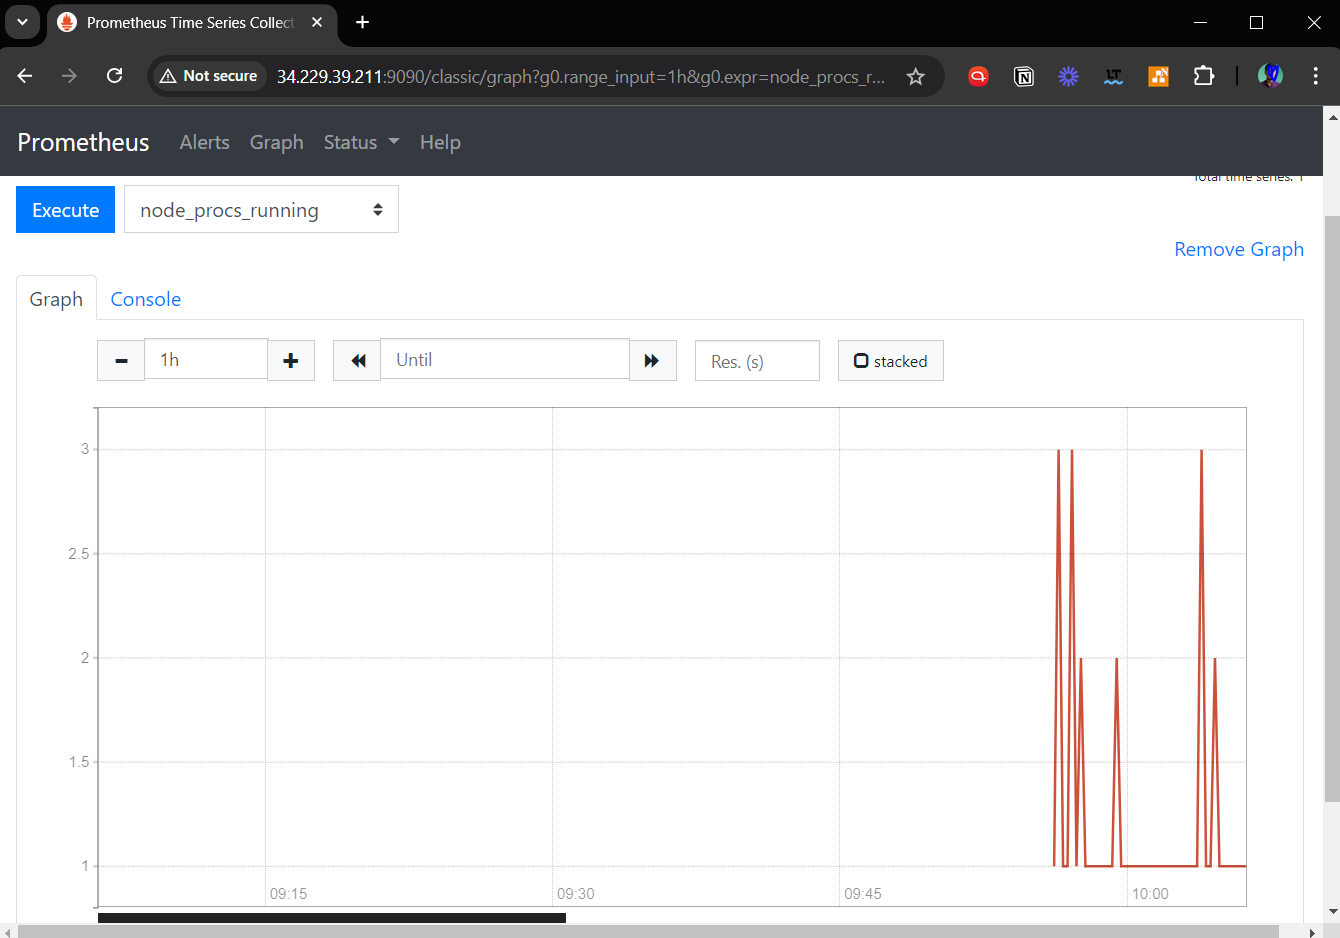
Step 5:
This shows the result of executing [node_procs_running].
FAQs to Install Prometheus on Ubuntu 24.04
How do I start the Prometheus service?
Use the command: sudo systemctl start prometheus.
How can I enable Prometheus to start on boot?
Enable the service with: sudo systemctl enable prometheus.
How do I check the status of the Prometheus service?
Use the command: sudo systemctl status prometheus.
What is the default port for Prometheus?
The default port is 9090.
How do I access the Prometheus web interface?
Open a web browser and navigate to http://<your-server-ip>:9090.
What configuration file does Prometheus use?
The main configuration file is located at /etc/prometheus/prometheus.yml.
Is there a graphical interface for Prometheus?
Yes, Prometheus provides a web UI for querying and visualizing metrics.
Conclusion
We hope this tutorial helped you understand how to install Prometheus on Ubuntu 24.04.
If you have any queries, please leave a comment below, and we’ll be happy to respond to them for sure.