

Introduction
Before we discuss top command in Linux, let's briefly understand - What is top command ?
The top command is a powerful tool in Linux used to monitor system resources. It provides real-time insights into CPU, memory, and process activity, aiding users in troubleshooting and optimizing their systems.
By displaying a dynamic, continuously updated list of processes, top allows users to identify resource-intensive tasks, prioritize them, and manage system performance effectively.
In this tutorial, you will understand top command in Linux. We will also address a few FAQs on top command in Linux.
top Command Syntax and Options
Type top into the command line and hit Enter to execute the command. When the command first runs, it displays the currently running processes along with other system data in interactive command mode. Use the available options to personalize the view.
The top command syntax, complete with all available flags and options, is shown below:
top -hv | -bcEeHiOSs1 -d secs -n max -u | U user -p pid(s) -o field -w [cols]
Whitespace and the switch (-) character are optional.
- -h: help, displays the help file for commands.
- -v: Version, displays the usage prompt and library version before ending the application.
- -b: Batch mode, Initiates top in batch mode, enabling the output of the command to be sent to a file or other applications. In batch mode,
topdoes not accept input and continues to run until it is terminated or reaches the designated iteration limit. - -c: Toggle command line/program name, Reverts the last C state that was remembered. Program names are shown in that field if the top displayed command lines, and vice versa.
- -d [secs.tenths]: Delay time interval, Prompts you to change the default value and specify the delay before updating the screen. The amount is expressed in seconds. Fractional seconds are accepted by the command, but negative values are not.
- -e [k | m | g | t | p]: Toggle task memory scaling, Changes the memory scaling of the top task area are possible. The scaling options that are available are k (kibibytes), m (mebibytes), g (gibibytes), t (tebibytes), p (pebibytes).
- -E [k | m | g | t | p | e]: Toggle summary memory scaling, Lets you adjust the memory scaling of the top summary area. The scaling options that are available are k (kibibytes), m (mebibytes), g (gibibytes), t (tebibytes), p (pebibytes), e (exbibytes).
- -H: Threads mode operation,When the -H option is used, top is told to show individual threads rather than the total number of threads in each process.
- -i: Idle process toggle, Reverts the last state that was remembered. The tasks that haven't used CPU resources since the last update aren't displayed in the top when the toggle is turned off.
- -n: Limit iteration number, Indicate the most iterations that should be produced before stopping.
- o [field name]: Overwrite sort field, Name the field that is most often used to sort tasks. When a + is added to the field name, tasks are sorted from high to low, and when a - is added, tasks are sorted from low to high. Operation in automated batch mode is mainly supported by the -o option.
- -O: Output field names, In addition to the -o option, the -O option causes top to print each field name that is available one at a time before terminating.
- -p [N1, N2...]: Monitor process IDs mode, Gives top the order to watch only the processes that have the given process IDs. Top displays all of the processes in each monitored PID thread group when combined with the threads mode (-H). There can be a maximum of 20 PIDs. The top program process ID is defined as having a PID value of 0. Any of the following commands: =, u, or U—will restore normal operation because they are mutually exclusive.
- -s: Secure mode operation, Even for root, starts top in secure mode.
- -S: Cumulative time toggle, Reverts the last S state that was recalled. Each process's CPU time is listed when the cumulative time toggle is turned ON.
- -u | -U [ID or name]: User filter mode, Only shows the processes that have the specified user name or ID. Whereas the -U option matches any user—real, effective, saved, or filesystem—the -u option only matches the effective user. When an exclamation point (!) is placed before the user ID or user name, top only shows the processes that don't match the input.
- -w [number]: Output width override, When -w is used without an argument, top is told to format the output, if applicable, using the environment variables COLUMNS= and LINES=. If not, the width is set at a maximum of 512 columns. The output width can be increased (up to 512) or decreased by appending an argument to -w, and the row number can be infinite. The application never grows larger than the terminal's real dimensions when top was called.
top Command Examples
The most typical top command use cases are listed below. Because the options depend on the case, pressing N and n will cause a different action to be performed.
List All Processes
To see a list of every Linux process that is currently operating on your system, open a terminal and type:
top
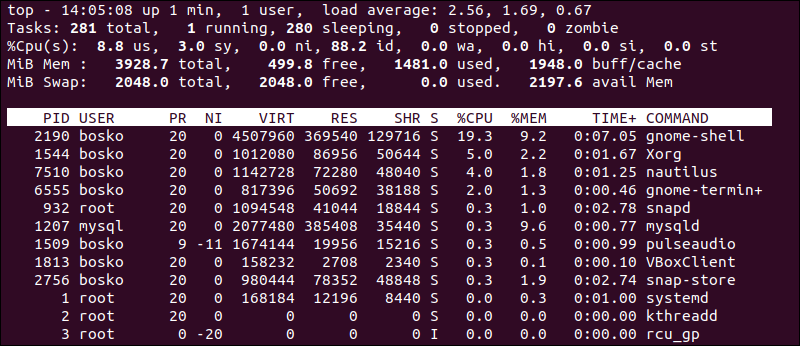
Here,
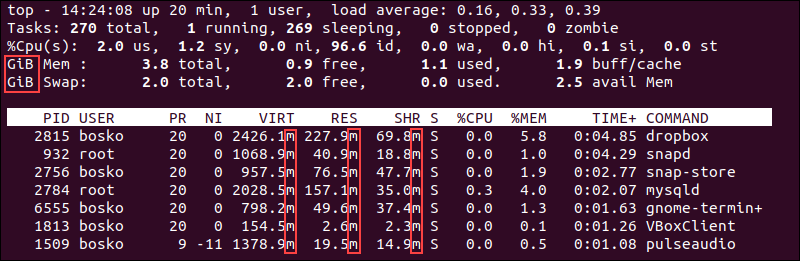
Line 1 (top)
- Time
- how long system is running
- how many users are logged in
- and load average
Line 2 (Tasks)
- Total number of tasks
- number of running tasks
- number of sleeping tasks
- number of stopped tasks
- and number of zombie tasks
Line 3 (Cpu(s))
It shows CPU usage in percentage for
- users
- system
- low priority processes
- idle processes
- io wait
- hardware interrupts
- software interrupts
- steal time
Line 4 (Mem)
It shows memory usage in kilobytes for
- total memory
- used memory
- free memory
- buffered memory
Line 5 (Swap)
It shows swap memory usage in kilobytes for
- total memory
- used memory
- free memory
- cached memory
Table Explanation
- PID: Shows task’s unique process id.
- PR: The process’s priority. The lower the number, the higher the priority.
- VIRT: Total virtual memory used by the task.
- USER: User name of owner of task.
- %CPU: Represents the CPU usage.
- TIME+: CPU Time, the same as ‘TIME’, but reflecting more granularity through hundredths of a second.
- SHR: Represents the Shared Memory size (kb) used by a task.
- NI: Represents a Nice Value of task. A Negative nice value implies higher priority, and positive Nice value means lower priority.
- %MEM: Shows the Memory usage of task.
- RES: How much physical RAM the process is using, measured in kilobytes.
- COMMAND: The name of the command that started the process.
The task area (a list of all processes) and summary area (a dashboard with resource usage stats) are displayed in the output. By default, top updates the data every three seconds.
Use the Page Up and Page Down keys and the Up and Down arrows to navigate a lengthy process list. Press q to end the top.
Send a Signal
To send any signal to a process that is already running, use the top command. To enter the process PID, press the k key. Allows you to type the desired signal at the top. The process ends if a specific signal is not entered.
For example:
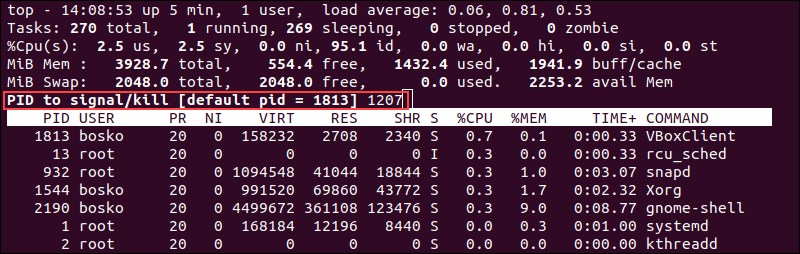
Here, we killed the mysql process 1207.
Exit After X Repetitions
Until the program is terminated by pressing q, the top command continuously refreshes the statistics. Give top instructions to automatically terminate after a predetermined number of stat refreshes.
The syntax is:
top -n [X]
Indicate how many times you want top to refresh the output for [X].
Example: Using the command below, the top command will automatically exit after repeating 10 times.
top -n 10
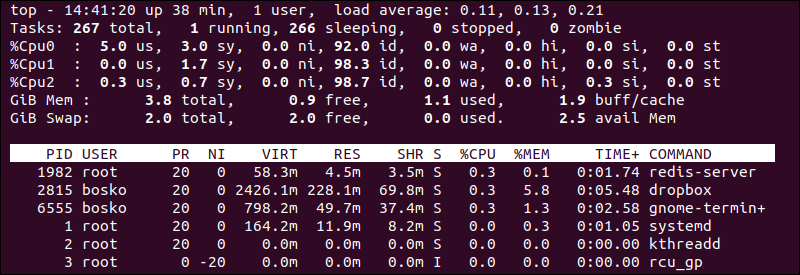
Sort Processes
The %CPU column is used by top by default to sort the list of processes. To arrange procedures according to an alternative column, hit any of the following keys:
- M. Sort by the
%MEMcolumn. - N. Sort by
PIDcolumn. - T. Sort by the
TIME+column. - P. Sort by the
%CPUcolumn.
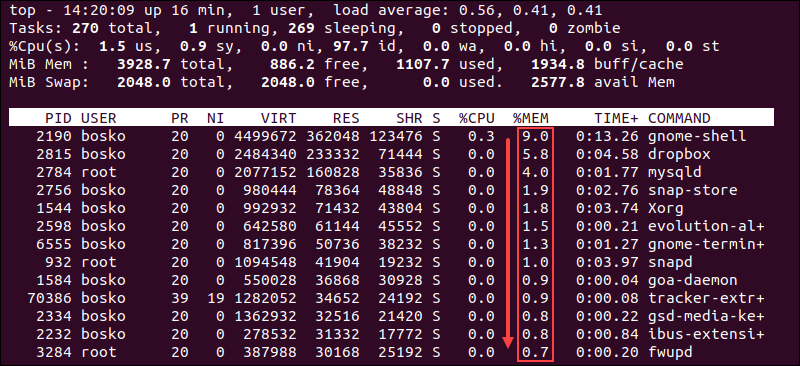
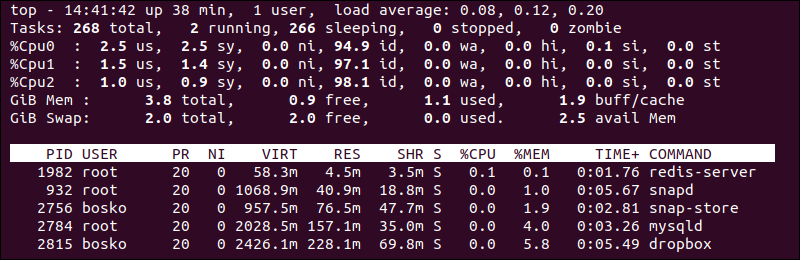
The %MEM column is used to sort the process list in the example that follows:
top, the modifications will take effect. The .toprc file located in your home directory contains the configurations.Filter Processes by Specific User
You can view all processes that are specific to a user by using the -u option. While top is running, press the u key or utilize the syntax as follows:
top -u [user name]
In interactive mode, pressing the u key will ask for the user name or user ID.
For example:
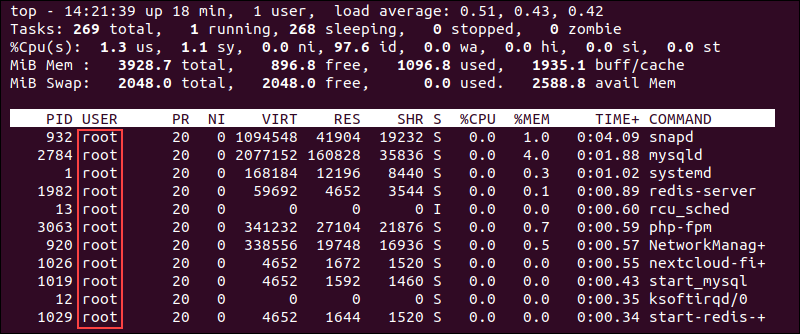
The output in the above example only displays processes for the root user.
Change Display Units
To select the units to be used for displaying the memory values, press the E key. To select the units for values to be displayed in the process list, press lowercase e. The choices that are available are:
- kibibytes (KiB)
- mebibytes (MiB)
- gibibytes (GiB)
- tebibytes (TiB)
- pebibytes (PiB)
- exbibytes (EiB - applies only for memory values)
The first item on lines four and five is the value that is being used at the moment, refer the image below.
The dashboard memory units in the example below are set to gibibytes, and the process list memory units are set to mebibytes:
Change Output Contents
The top output by default is quite detailed and could be confusing. With a few keystrokes, you can adjust the contents, locate the information you require, or remove specific sections from the summary.
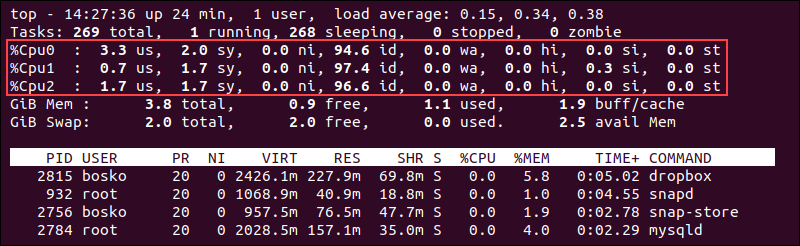
Individual CPU Core Statistics
You can view specific CPU core statistics by pressing the 1 key on your keyboard. Toggle core statistics by repeatedly pressing 1.
CPU Usage Graph
Top provides simple ASCII graphs that show the usage of each CPU core if you'd like a visual depiction of your CPU usage. Press t to turn the graphs on or off.
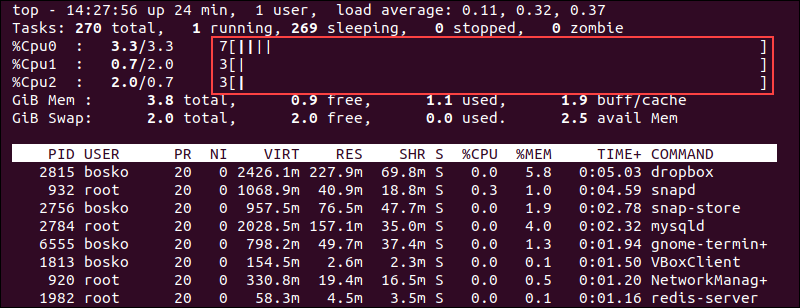
Press t once more to switch to solid block characters on the graph display.
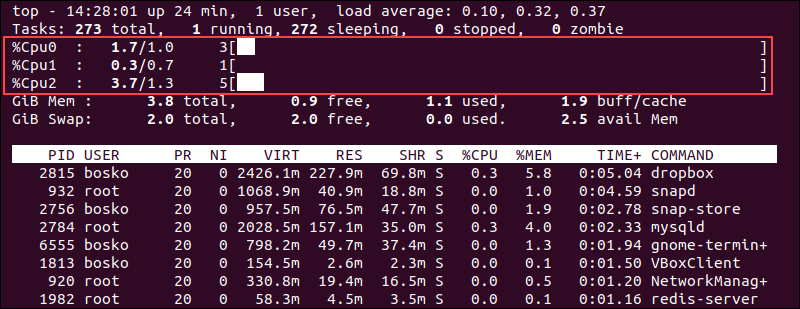
To remove the task summary section and CPU display, press t once more.
Memory Usage Graph
Additionally, the command allows memory and swap memory lines to be displayed graphically. Press m to see a visual representation of the amount of memory used. Press m once more to erase the lines.
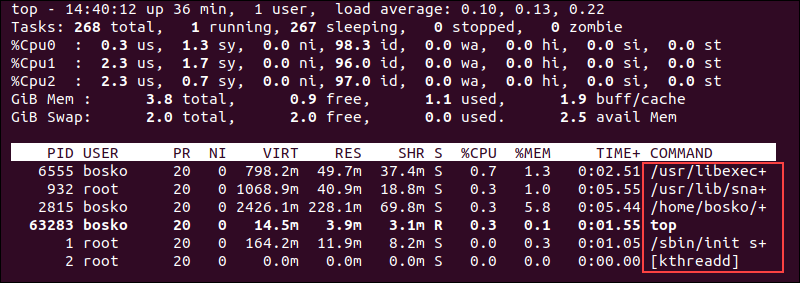
Show Process Command Line
Press the c key to view the entire command line rather than the process name. Press c once more to switch back to seeing the process name.
See Process Hierarchy
Press the V key to see which processes were launched or spawned by other processes.
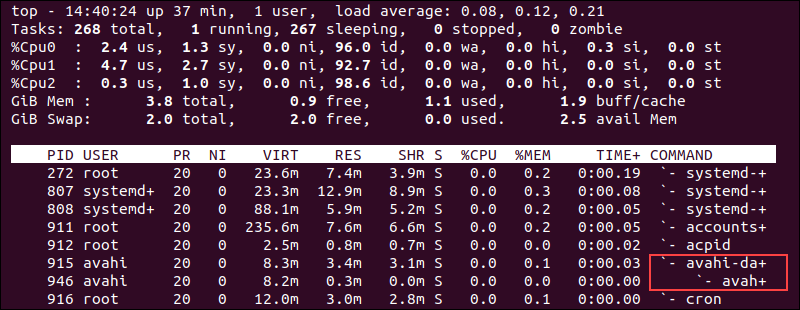
If you wish to see the hierarchy of child-parent processes on your system, you can use the tree view.
Show Active Tasks
Press the I key to filter the output and display only tasks that are active.
The output does not show tasks that have not utilized any CPU resources since the last update.
Limit Process Number
To restrict the process number in the output, press the n key. Whatever the quantity of running processes. You are prompted to enter the desired number of processes to view at the top.
For instance, we wish to display just the top 5 procedures:
Change Process Priority
The process priority can be changed with the top command (nice value).
Take these actions:
- Press the
rkey while running top. - Type the process ID and hit Enter when prompted.
- The software asks you to enter a new nice value after you enter the PID. After entering a new value, hit Enter.
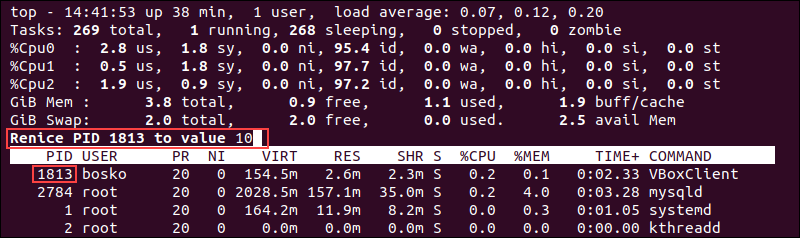
Note: A higher process priority is indicated by negative nice values.
For instance, we've given a VBoxClient process instance the lovely value of 10:
Filter Processes
Using a filter expression, the top filter feature lets you restrict which processes are visible in the list. Pressing the o key will activate the filter option. You are prompted by the program to enter a filter expression.
As an example, we used the following filter:
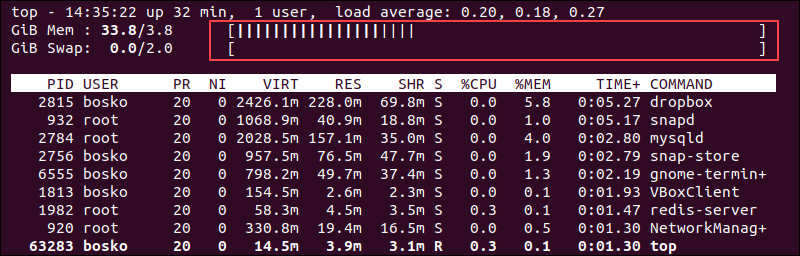
%MEM>5.0
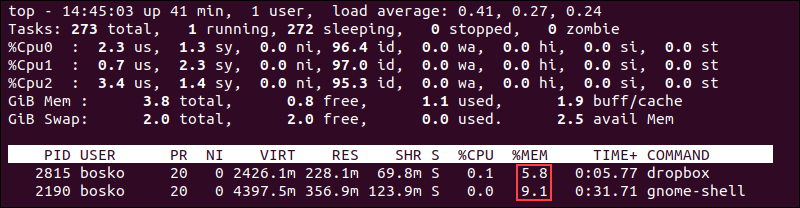
Only the processes using more than 5% of the RAM are now displayed by the top command. To remove the filters, hit the '=' key.
Batch Mode
The command will start the top command in Batch mode, allowing you to capture the output and send it to a file or other programs, without requiring any interactive input.
top -b
Delay time
The command below, will set the delay between screen updates to the specified number of seconds and tenths of a second.
top -d seconds.tenths
FAQs on top command in Linux
How do I run the top command?
Simply open a terminal and type top to launch the top command interface.
Can I sort processes using the top command?
Yes, you can sort processes by various criteria like CPU usage, memory usage, and more by pressing different keys while running top.
How do I quit the top command?
Press q to exit the top command interface.
What information does top display?
top displays a dynamic list of running processes along with system resource utilization statistics.
Can I change the update interval of top?
Yes, you can change the update interval by pressing s and entering a new value in seconds.
Can I filter processes using the top command?
Yes, you can filter processes by user or process name by pressing u or k respectively.
How can I save top command output to a file?
While running top, press W to save the current configuration, including process details, to a file.
Conclusion
We hope this tutorial helped you understand how to use top command in Linux.
If you have any queries, please leave a comment below, and we’ll be happy to respond to them for sure.