
Choose a different version or distribution
Introduction
Before we begin talking about how to install Prometheus on CentOS 8, let's briefly understand – What is Prometheus?
Prometheus is a powerful open-source monitoring and alerting system widely used in IT environments. It helps track and analyze the performance of various components in real-time, including servers, applications, and networks. With its flexible data model and robust querying language, Prometheus enables efficient data collection and visualization.
It also offers advanced features like alerting, graphing, and data exporting, making it a popular choice for managing complex infrastructure. By providing valuable insights into system health and performance, Prometheus empowers organizations to optimize their operations and ensure smooth functioning.
In this tutorial, we will look at the installation of Prometheus on the CentOS 8 system. We will also address some FAQs on how to install Prometheus on CentOS 8.
Advantages of Prometheus
- Real-time monitoring: Prometheus provides real-time monitoring of servers, applications, and networks, allowing organizations to promptly identify and address performance issues.
- Flexible data model: Its flexible data model enables efficient data collection and easy customization of metrics, making it adaptable to various monitoring needs.
- Powerful querying language: With a robust querying language, Prometheus allows users to retrieve and analyze data effectively, gaining valuable insights into system performance.
- Alerting system: Prometheus offers an advanced alerting system, enabling timely notifications and proactive management of critical events or anomalies.
- Extensive ecosystem: Its rich ecosystem includes a wide range of integrations, exporters, and visualization tools, enhancing its functionality and ease of use for diverse monitoring tasks.
Step 1 - Creating a Prometheus user and group
We'll begin by setting up a system user for Prometheus. To do this, use the command below:
useradd -m -s /bin/false prometheus
id prometheus
Output

uid=1002(prometheus) gid=1002(prometheus) groups=1002(prometheus)
As you may have seen, the /bin/false option specifies that the system user has no login permissions.
Step 2 - Creating configuration directories for Prometheus
We'll build a configuration directory in /var to store Prometheus configuration files and data when the user for Prometheus has been created. So, execute the following commands:
sudo mkdir /var/lib/prometheus
The ownership of /var/lib/prometheus has been changed:
sudo chown prometheus /var/lib/prometheus/
Step 3 - Downloading Prometheus tar file
The directories are now set up, so we can download the Prometheus. Go to the Download page to get the most recent version for your environment. The most recent version was v 2.14.0 at the time this article was being written. Alternatively, just execute the command below:
sudo dnf install wget -y
wget https://github.com/prometheus/prometheus/releases/download/v2.45.0/prometheus-2.45.0.linux-amd64.tar.gz -P /tmp
Once the download is finished, open the tarball file and extract it as follows:
tar -zxpvf prometheus-2.45.0.linux-amd64.tar.gz
After doing so, you'll find a directory named prometheus-2.45.0.linux-amd64.
To view the directory structure, use the tree command:
We must copy the two binary files prometheus and promtool from the extracted directory to the /usr/local/bin path.
So, use the following command to copy them and navigate to the extracted directory:
cd /tmp/prometheus-2.45.0.linux-amd64
sudo cp prometheus /usr/local/bin
Do the same with the other binary file:
sudo cp promtool /usr/local/bin
Step 4 - Creating a configuration directory for Prometheus
Rename and move /tmp/prometheus-2.45.0.linux-amd64 to /etc/prometheus
sudo mv prometheus-2.45.0.linux-amd64 /etc/prometheus
Only your local system (Prometheus Server) will be monitored by default.
In order to enable external connections to the server via port 9090, modify the firewall as follows:
firewall-cmd --add-port=9090/tcp --permanent
firewall-cmd --reload
Step 5 - Creating a Systemd service file for Prometheus Server
We must construct a system file in order to use systemd to handle Prometheus as a service. So, make the file as indicated and paste the content:
sudo vi /etc/systemd/system/prometheus.service
[Unit]
Description=Prometheus Time Series Collection and Processing Server
Wants=network-online.target
After=network-online.target

[Service]
User=prometheus
Group=prometheus
Type=simple
ExecStart=/usr/local/bin/prometheus \
    --config.file /etc/prometheus/prometheus.yml \
    --storage.tsdb.path /var/lib/prometheus/ \
    --web.console.templates=/etc/prometheus/consoles \
    --web.console.libraries=/etc/prometheus/console_libraries

[Install]
WantedBy=multi-user.target
Reload the systemctl for the modifications to take effect:
sudo systemctl daemon-reload
Now start Prometheus and enable it to execute on boot:
sudo systemctl start prometheus
sudo systemctl enable prometheus
Run the following command to make sure Prometheus is up and running:
sudo systemctl status prometheus
We can verify without a doubt from the output that Prometheus is functioning without any faults. Additionally, you can check whether the service is listening on port 9090 using the Netstat program:
netstat -tunlp
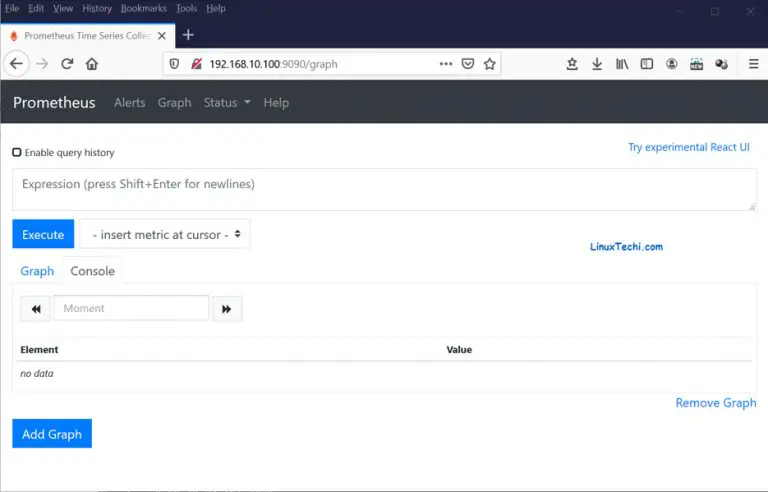
Prometheus is operating as planned on port 9090. Now open your browser and navigate to your server's IP address as shown:
http://server-ip:9090
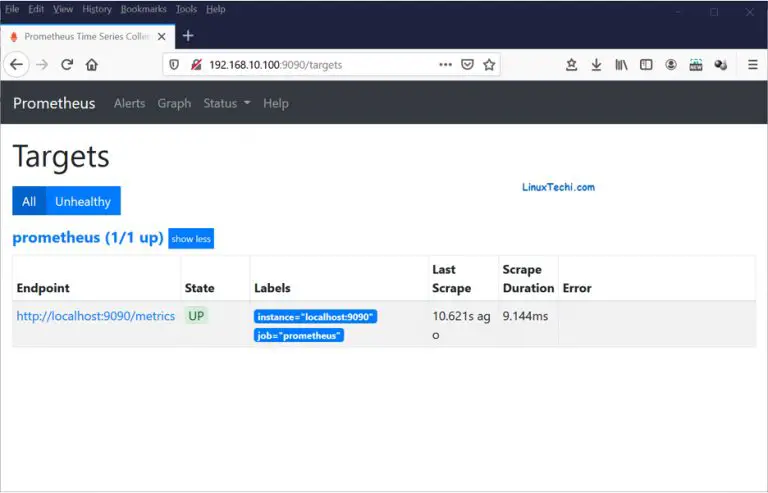
Click on the 'Status' tab, then on 'Targets':
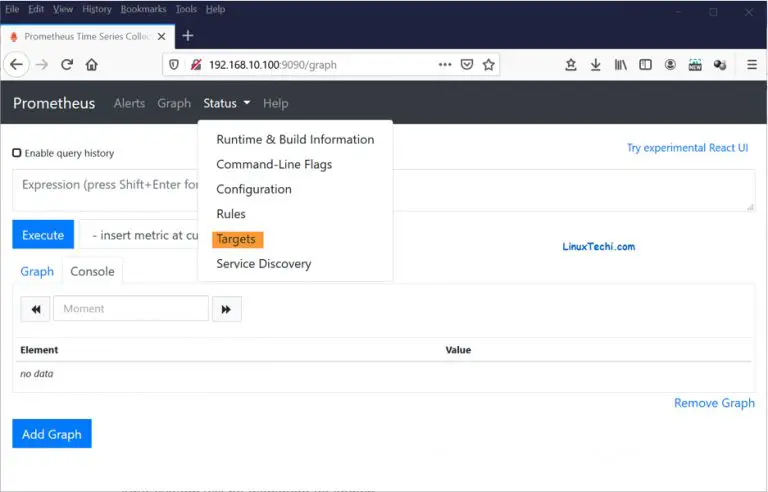
Your system will seem as follows:
Step 6 - Install & configure node_exporter
Node exporter is a tool that gathers and sends a wide range of Linux system metrics, including network statistics, CPU, and memory usage. We'll install node_exporter on the Prometheus server and a different CentOS 8 Linux host in this part, then check system metrics on both hosts.
We're going to make node_exporter a system user on the Prometheus node.
sudo useradd -m -s /bin/false node_exporter
Then, go to Prometheus' downloads page and download the node_exporter tarball, or use the wget command below to do so from the command line.
wget https://github.com/prometheus/node_exporter/releases/download/v1.6.0/node_exporter-1.6.0.linux-amd64.tar.gz
Once you've downloaded the node_exporter file, extract it as follows.
tar -zxpvf node_exporter-1.6.0.linux-amd64.tar.gz
Using the tree command as demonstrated, you may examine the contents of the extracted folder.
tree node_exporter-1.6.0.linux-amd64
Next, add the node_exporter binary file to the /usr/local/bin path.
sudo cp node_exporter-1.6.0.linux-amd64/node_exporter /usr/local/bin
Once the node_exporter file has been copied, set its file permissions as displayed.
sudo chown node_exporter:node_exporter /usr/local/bin/node_exporter
The next step is to set up node_exporter such that it functions as a service. Therefore, create the systemd service file as directed.
sudo vi /etc/systemd/system/node_exporter.service
After that, save the file after pasting the configuration as shown below.
[Unit]
Description=Prometheus Node Exporter
Wants=network-online.target
After=network-online.target

[Service]
User=node_exporter
Group=node_exporter
Type=simple
ExecStart=/usr/local/bin/node_exporter

[Install]
WantedBy=multi-user.target
Reload systemd manager with the following command for the modifications to take effect:
sudo systemctl daemon-reload
Start the node_exporter service and then make it active.
sudo systemctl start node_exporter
sudo systemctl enable node_exporter
Execute the following command to make sure the service is active:
sudo systemctl status node_exporter
Use the Netstat tool to verify that the service is up and running and is, as would be expected, listening on port 9100.
netstat -pnltu | grep 9100
Output

tcp6       0      0 :::9100       :::*          LISTEN      3472/node_exporter
Perfect! The node_exporter service is operating properly.
After that, enable firewall port 9100 as displayed:
sudo firewall-cmd --add-port=9100/tcp  --permanent
sudo firewall-cmd --reload
Follow the same procedure for the remote CentOS 8 Linux system.
The prometheus.yml file has to have the node_exporter target added. Add the following lines to the Prometheus server's definition of node_exporter:
vi /etc/prometheus/prometheus.yml
  - job_name: 'node_exporter'
      static_configs:
        - targets: ['localhost:9100']
Check the syntax using promtool:
promtool check config /etc/prometheus/prometheus.yml
Start the Prometheus service again:
sudo systemctl restart prometheus
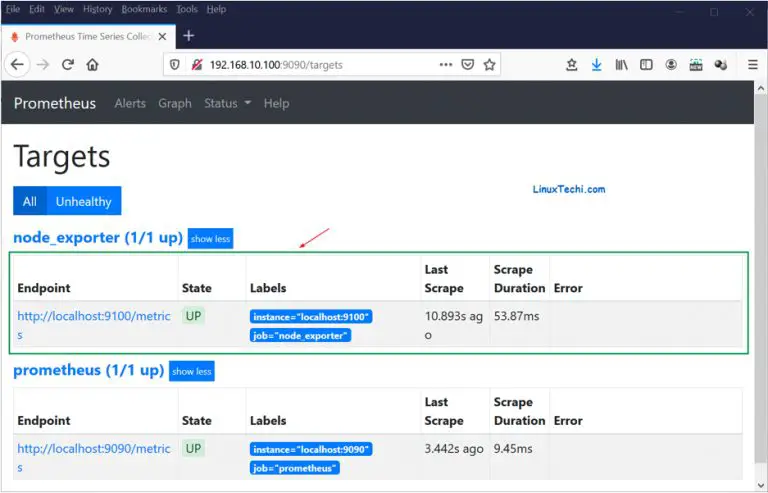
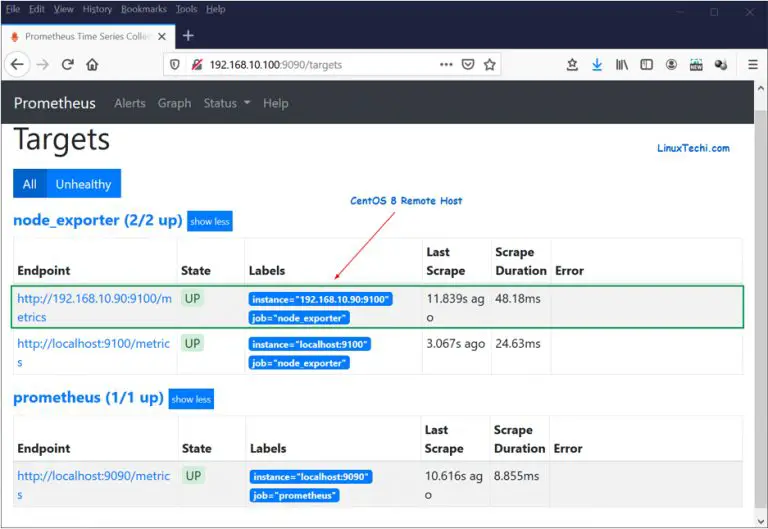
Go back to your browser, select the "Status" tab, and then select "Targets."
Keep an eye out for a new endpoint for the Prometheus server on the browser called node_exporter.
Go back to the prometheus.yml file and add the line below to create an endpoint for the remote Linux system:
– targets: [‘192.168.10.90:9100’]
Now, the node_exporter section ought to resemble the following:
 - job_name: 'node_exporter'
   static_configs:
   - targets: ['localhost:9100']
   - targets: ['192.168.10.90:9100']
Restart the Prometheus service after saving the changes:
sudo systemctl restart prometheus
Refresh the browser to see the second endpoint for the remote CentOS Linux machine that has been added.
To confirm that you are receiving metrics from your configured nodes, use the curl command as shown:
curl http://localhost:9100/metrics
I ran the following command for the remote CentOS 8 host:
curl http://192.168.10.90:9100/metrics
You can also do this by launching a browser and going to the following URL:
http://192.168.10.90:9100/metrics
Additionally, you have the option to graph any metrics you like. Simply navigate to the Prometheus server's home page and select "insert metric at cursor" from the drop-down menu.
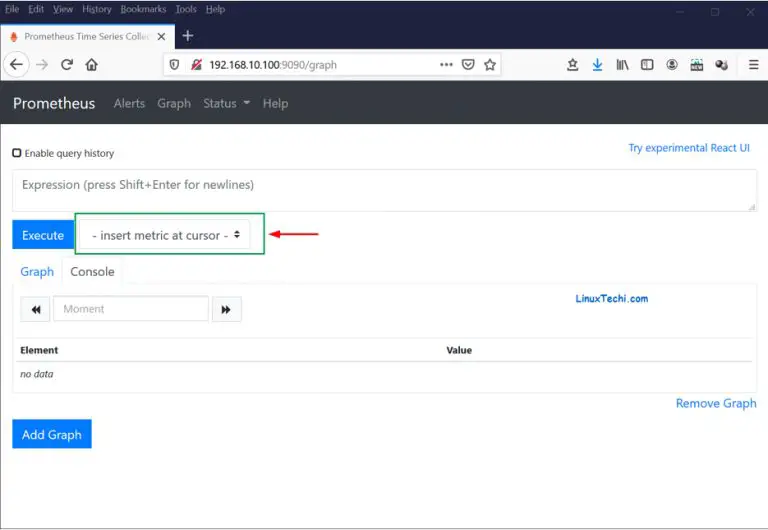
Choose the metric you want to graph.
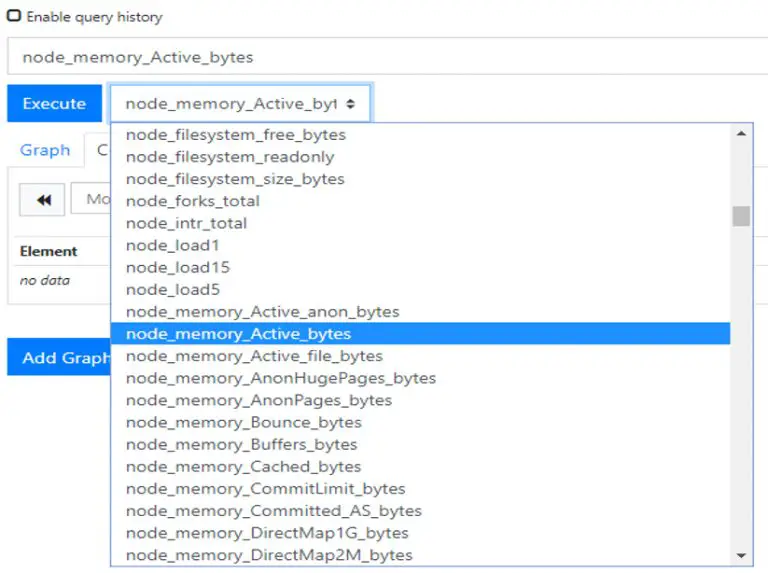
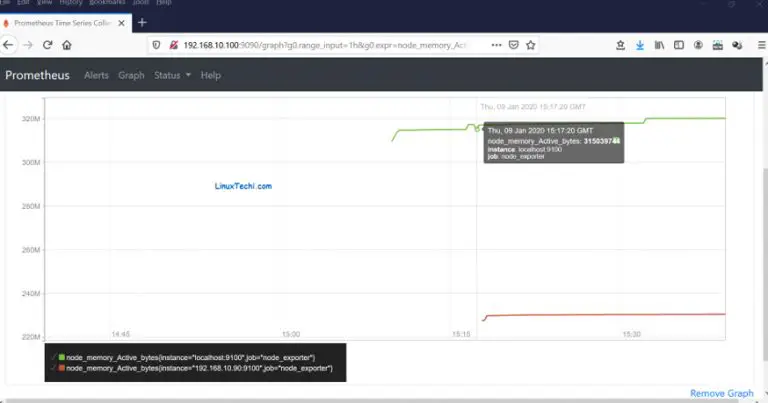
To view the graph, click the "Execute" button and then the "graph" tab directly below it.
FAQs to Install Prometheus on CentOS 8
What are the system requirements for installing Prometheus on CentOS 8?
Prometheus has modest system requirements. A CentOS 8 system with a minimum of 2 GB RAM and sufficient disk space is recommended.
Can I install Prometheus using package managers like Yum or DNF?
No, Prometheus does not have official packages for CentOS. It is recommended to install Prometheus manually by downloading and configuring the package.
How can I access the Prometheus web interface after installation?
By default, Prometheus listens on port 9090. You can access the web interface by opening a browser and entering "http://your-server-ip:9090" in the address bar.
How can I configure Prometheus to monitor specific targets?
Edit the prometheus.yml file and add the target's details under the scrape_configs section. Specify the target's URL and any necessary additional parameters.
How do I set up alerting with Prometheus on CentOS 8?
Configure alerting rules in the prometheus.yml file. Set up an alert manager to handle alerts. Restart Prometheus after making changes for the alerting rules to take effect.
How can I ensure that Prometheus starts automatically on system boot?
Create a systemd service unit file for Prometheus and place it in the appropriate directory. Use the systemctl command to enable and start the Prometheus service.
Are there any security considerations when installing Prometheus on CentOS 8?
Yes, it is recommended to secure Prometheus by enabling authentication, setting up SSL/TLS encryption, and restricting access to the Prometheus server and metrics endpoints.
Conclusion
Prometheus has been successfully installed and set up to track system metrics on your server and a remote host.
We hope this detailed tutorial helped you to Install Prometheus on CentOS 8.
If you have any queries, feel free to drop a comment below, and we'll be happy to help.